Natural Gas Commodity Elliott Wave Analysis

Natural Gas Elliott Wave Technical Analysis

Natural gas is currently in a recovery phase after a significant bearish trend throughout 2024. However, this downtrend is expected to strengthen in the coming weeks. After a strong rebound from the February 2024 low, natural gas has retraced more than two-thirds of those gains, indicating a possible revisit to the 2020 lows. The broader trend has been bearish since August 2022, and despite a short-term recovery that started on August 5th, it is likely to be temporary. Sellers may regain control later this month or by early September.

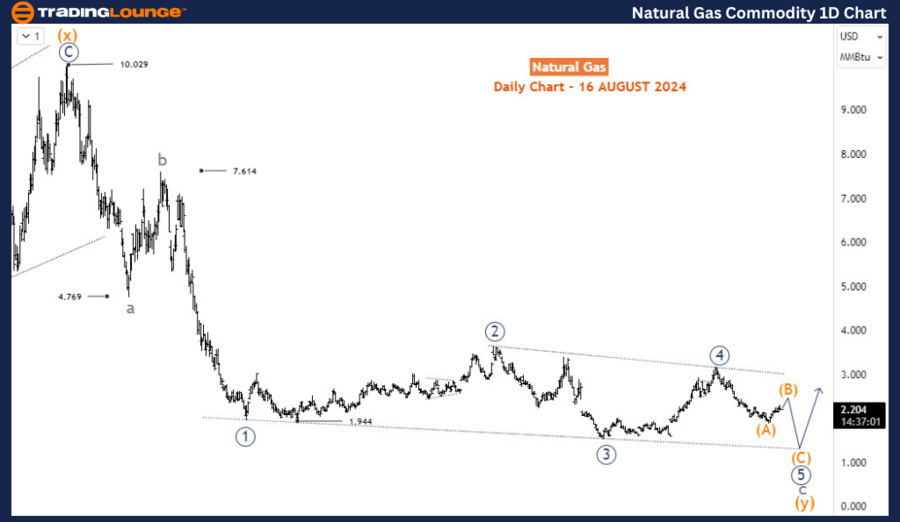
TradingLounge Commodity Natural Gas Daily Chart Analysis

On the daily chart, the decline from the $10 high in August 2022 is forming a corrective pattern, labeled as waves a-b-c of the cycle degree. Wave a concluded near 4.77, followed by wave b, which ended around 7.61. Since November 2022, wave c has been unfolding as an ending diagonal pattern. Currently, the 5th leg (wave 5, circled) within this diagonal is ongoing, and it is expected to continue downward in a three-wave structure. This movement is likely to break below the 3rd wave low (wave 3, circled) at 1.524, signaling further downside before the pattern completes. The 5th wave (circled) of c of (y) is anticipated to develop into a three-wave structure, which is more evident on the H4 chart.

Natural-Gas-commodit...


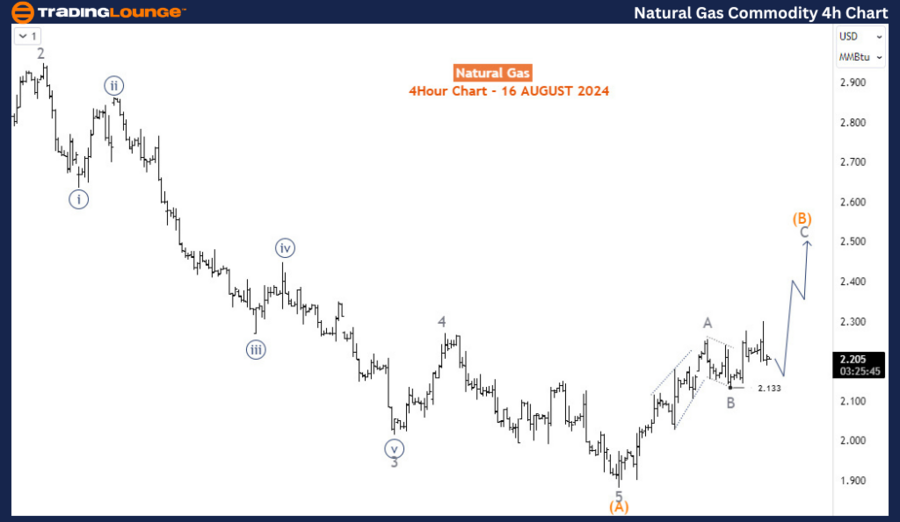
TradingLounge Commodity Natural Gas 4-Hour Chart Analysis

Natural Gas Commodity Market

On the H4 chart, the price has completed wave (A) of 5 (circled) and is currently correcting upward in wave (B). Once wave (B) is complete, the price is expected to resume its decline in wave (C). However, wave (B) has not yet finished, so in the near term, the commodity is favoring an upside move.

Conclusion

Natural gas is in a complex corrective phase, with potential short-term gains likely to give way to a continuation of the broader downtrend. The Elliott Wave analysis suggests that while brief rallies may occur, the overall outlook remains bearish, with further declines anticipated once the current corrective wave (B) is complete. Traders should be cautious of the temporary recovery and prepare for potential downside movement as the broader bearish trend reasserts itself.

Technical Analyst: Sanmi Adeagbo

Source: visit Tradinglounge.com and learn From the Experts Join TradingLounge Here 

See Previous: SGX TSI Iron Ore Index Elliott Wave Technical Analysis

Special Trial Offer - 0.76 Cents a Day for 3 Months! Click here

Access 7 Analysts Over 170 Markets Covered. Chat Room With Support

Natural-Gas-commodit...

Related

Using Elliott Wave Theory We Forecast Potential Shifts in DE Stock: Deere & Co Stock Current Market Trends and Movements

Using Elliott Wave Theory We Forecast Potential Shifts in DE Stock: Deere & Co Stock Current Market Trends and Movements

This detailed Elliott Wave analysis of Deere & Co. (DE) highlights current market trends and price m...

Read More >
U.S. Dollar / Canadian Dollar (USDCAD) Forex Elliott Wave Technical Analysis: Unveiling Bullish Momentum and Strategic Insights

U.S. Dollar / Canadian Dollar (USDCAD) Forex Elliott Wave Technical Analysis: Unveiling Bullish Momentum and Strategic Insights

Gain insights into the USDCAD Elliott Wave analysis focusing on bullish momentum in wave 5. Explore ...

Read More >
Expert Elliott Wave Technical Analysis for ASX: REA GROUP LTD – Accurate Stock Forecasts and Winning Trading Strategies

Expert Elliott Wave Technical Analysis for ASX: REA GROUP LTD – Accurate Stock Forecasts and Winning Trading Strategies

Explore the comprehensive Elliott Wave analysis for ASX: REA GROUP LTD. This article provides an in-...

Read More >
Thoroughly Analyses the CAC 40, Featuring Elliott Wave Insights, Technical Analysis, and Forecasts: CAC 40 Trading Strategies

Thoroughly Analyses the CAC 40, Featuring Elliott Wave Insights, Technical Analysis, and Forecasts: CAC 40 Trading Strategies

This article thoroughly analyses the CAC 40, featuring Elliott Wave insights, technical analysis, an...

Read More >
Natural Gas Elliott Wave Technical Analysis: Key Resistance Zone Ahead

Natural Gas Elliott Wave Technical Analysis: Key Resistance Zone Ahead

Natural gas prices are nearing a critical resistance zone after experiencing an upward correction wi...

Read More >

Buy 1 Month

Get 3 Months!

Special Offer:

Trade Recommendations

Unleash the power of deversified trading with our comprehensive portfolio, covering:

  • Stock Trades
  • Crypto Trades
  • Forex Trades
  • Commodity Trades
Elliott Wave Analysis

Gain a competive edge with expert insights in to:

  • Global Indices
  • US Stocks & ASX Stocks
  • Forex & Crypto
  • Commodities
Top-Notch Trading Tools

Equip yourself with the tools of success:

  • Social Chat
  • Elliott Wave Algorithm
  • Screener
  • TradingLevels
  • Trading Game
7 Elliott Wave Analysts

Stay ahead of the market with daily charts and insightful videos
-Your secret to strategic trading!

JOIN HERE


Welcome to TradingLounge (ASIC A.R.No. 321187), specialists in trades, trading education and technical analysis, covering stocks, indices, commodities, forex and cryptocurrencies.

When you join TradingLounge you have access to everything we offer, including trade tools, educational content and a social platform to chat with like-minded investors.

Read more

@Copyright 2024 by tradinglounge.com

Contact Us

Australian no: 02 4787 6020

International no: +61 (2) 47876020

Pay with:

Find us on