HCL Technologies – HCLTECH Elliott Wave Analysis (1D Chart)

Function: Larger Degree Trend Higher (Intermediate degree, orange)

Mode: Motive

Structure: Impulse

Position: Minute Wave ((iii)) Navy

Details: Minute Wave ((iii)) is advancing higher within Minor Wave 5 against the 1480 level.

Invalidation Point: 1480

HCLTECH Elliott Wave Technical Analysis

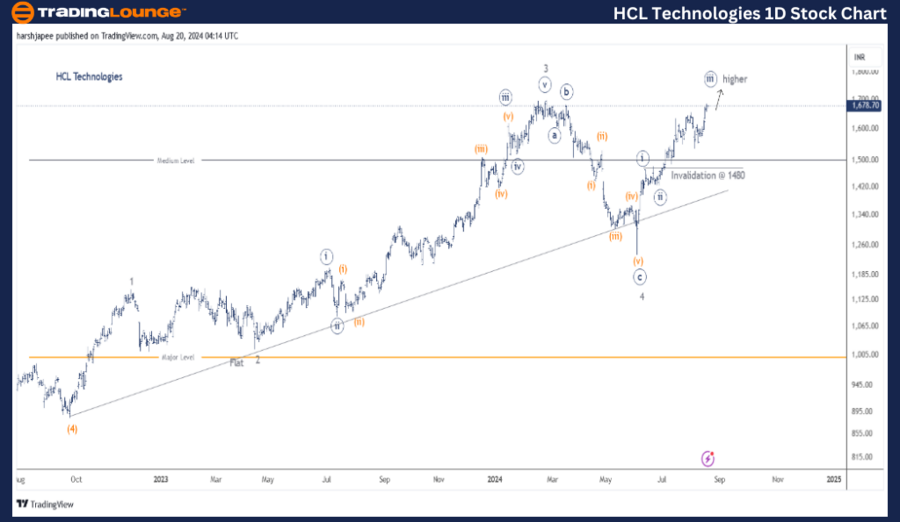
HCL Technologies Daily Chart Technical Analysis and Elliott Wave Counts

The HCL Technologies daily chart suggests the stock is progressing within Minor Wave 5, targeting the 1230 level in the medium term. The current pattern is an impulse wave, with Minute Wave ((iii)) likely unfolding now.

The stock bottomed around the 880 mark in September 2022, completing Intermediate Wave (4). Since then, a potential five-wave rally appears to be in progress. Minor Wave 4 concluded at 1230, and the trend remains bullish above this low.

Last week, the stock rallied over 100 points from the 1560-70 range up to 1680, as projected. In the coming days, prices are expected to gain momentum and move towards the 1700-50 range, with the 1480 level as a key support, marking the high of Minute Wave ((i)).

HCL-Technologies-1D-...


HCL Technologies – HCLTECH Elliott Wave Technical Analysis (4H Chart)

Function: Larger Degree Trend Higher (Minute degree, Wave ((iii)) Grey)

Mode: Motive

Structure: Impulse

Position: Minute Wave ((iii)) Navy

Details: Minute Wave ((iii)) is advancing higher within Minor Wave 5 against the 1480 level.

Invalidation Point: 1480

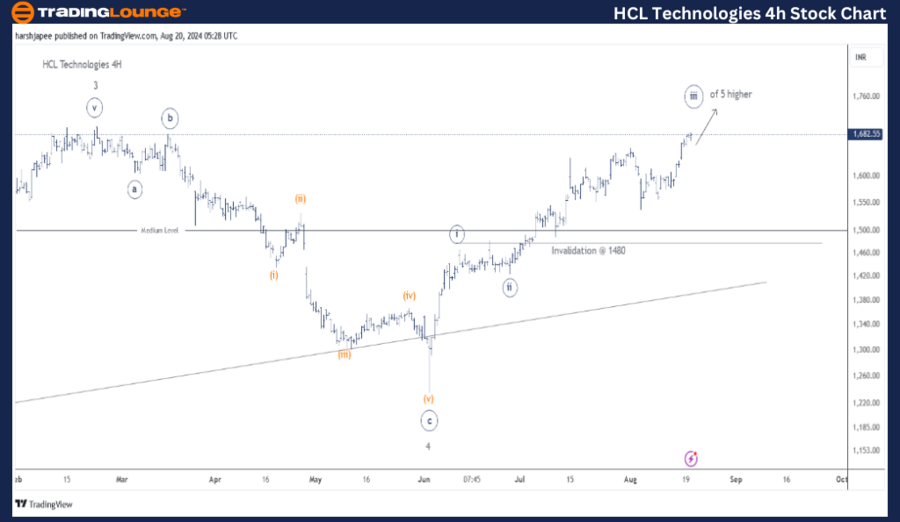
HCL Technologies 4H Chart Technical Analysis and Elliott Wave Counts

The HCL Technologies 4H chart showcases Minor Wave 4 forming as a flat (3-3-5) between the 1670-75 range and the 1230-40 low. Following this, Minor Wave 5 is likely advancing higher as an impulse, with projections suggesting it could rally beyond the 1750 high in the near term.

Additionally, Minute Waves ((i)) and ((ii)) are complete near the 1480 and 1420 levels. If these levels hold, the price is expected to continue rising, staying above 1480, to complete the proposed impulse wave. Currently, Minute Wave ((iii)) appears to be underway.

Immediate price support is around 1537, potentially marking the low of Minuette Wave (ii). If correct, prices should remain above this level as Minuette Wave (iii) continues to develop.

Technical Analyst: Harsh Japee

Source: visit Tradinglounge.com and learn From the Experts Join TradingLounge Here 

Previous: ADANI ENTERPRISES LTD Elliott Wave Analysis

Special Trial Offer - 0.76 Cents a Day for 3 Months! Click here

Access 7 Analysts Over 200 Markets Covered. Chat Room With Support

HCL-Technologies-4H-...


Conclusion

HCL Technologies seems set to push towards the 1750 zone in the upcoming trading sessions as Minute Wave ((iii)) continues to unfold within Minor Wave 5, targeting the 1230-40 level.

Related

TASI Index Elliott Wave Technical Analysis: Daily and Weekly Charts, Offering Insights and Strategies for the Saudi Stock Market

TASI Index Elliott Wave Technical Analysis: Daily and Weekly Charts, Offering Insights and Strategies for the Saudi Stock Market

The TASI Index is showing strong bullish momentum according to Elliott Wave analysis. Key highlights...

Read More >
Impulse Wave iii) Topping—Elliott Wave Analysis of Major Indices and Tech Stocks

Impulse Wave iii) Topping—Elliott Wave Analysis of Major Indices and Tech Stocks

The strong upward movement in major stock indices and tech stocks suggests that impulse wave iii) ma...

Read More >
DOTUSD Elliott Wave Analysis: Polkadot Crypto Price Predictions, Technical Indicators, and Enhance Your Trading Strategy

DOTUSD Elliott Wave Analysis: Polkadot Crypto Price Predictions, Technical Indicators, and Enhance Your Trading Strategy

This article provides a detailed Elliott Wave analysis of DOT/USD, offering insights into Polkadot’...

Read More >
Saudi Stock Market Update: TASI Index Elliott Wave Technical Analysis Shows an Impulsive Bullish Trend

Saudi Stock Market Update: TASI Index Elliott Wave Technical Analysis Shows an Impulsive Bullish Trend

The TASI Index is currently in an impulsive bullish trend, with the market advancing through gray wa...

Read More >
Offering Valuable Insights for Strategic Trading in Commodity Market: Wheat Elliott Wave Technical Analysis

Offering Valuable Insights for Strategic Trading in Commodity Market: Wheat Elliott Wave Technical Analysis

This article provides an in-depth analysis of wheat prices using Elliott Wave theory. It covers the ...

Read More >
Visa Inc.(V:NYSE) Elliott Wave Technical Analysis 23 November 23

Visa Inc.(V:NYSE) Elliott Wave Technical Analysis 23 November 23

Visa Inc.(V: NYSE) Elliott Wave Technical Analysis Dated 23 November 23 with 1Hr and 4Hr Chart,

Read More >

Buy 1 Month

Get 3 Months!

Special Offer:

Trade Recommendations

Unleash the power of deversified trading with our comprehensive portfolio, covering:

  • Stock Trades
  • Crypto Trades
  • Forex Trades
  • Commodity Trades
Elliott Wave Analysis

Gain a competive edge with expert insights in to:

  • Global Indices
  • US Stocks & ASX Stocks
  • Forex & Crypto
  • Commodities
Top-Notch Trading Tools

Equip yourself with the tools of success:

  • Social Chat
  • Elliott Wave Algorithm
  • Screener
  • TradingLevels
  • Trading Game
7 Elliott Wave Analysts

Stay ahead of the market with daily charts and insightful videos
-Your secret to strategic trading!

JOIN HERE


Welcome to TradingLounge (ASIC A.R.No. 321187), specialists in trades, trading education and technical analysis, covering stocks, indices, commodities, forex and cryptocurrencies.

When you join TradingLounge you have access to everything we offer, including trade tools, educational content and a social platform to chat with like-minded investors.

Read more

@Copyright 2024 by tradinglounge.com

Contact Us

Australian no: 02 4787 6020

International no: +61 (2) 47876020

Pay with:

Find us on