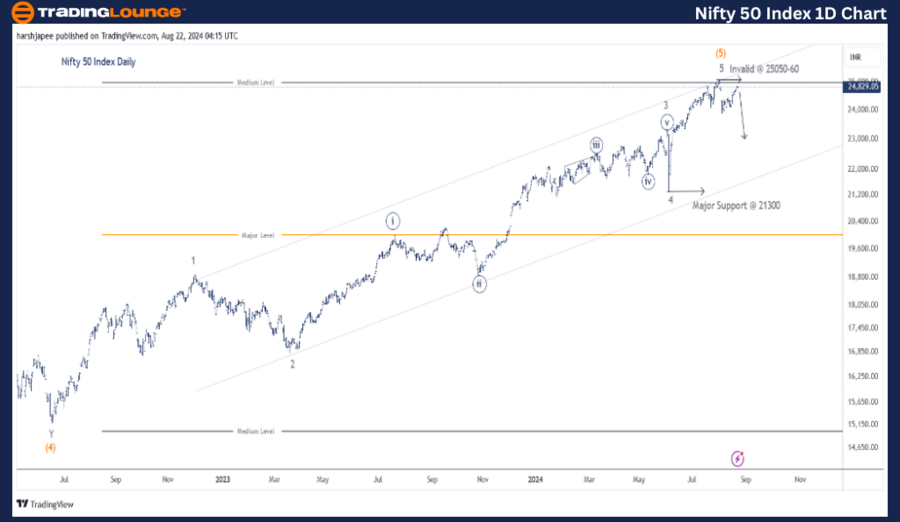
NIFTY 50 INDEX – NIFTY Elliott Wave Analysis 1D Chart

Nifty 50 Index Daily Chart Analysis

Function: Corrective Lower (Intermediate degree, orange)

Mode: Corrective

Structure: Potential Impulse within a larger degree Corrective Wave

Position: Potential Minute Wave ((ii)); unmarked as it's still early

Details: As previously discussed, the potential Minor Wave 5 Grey of Intermediate Wave (5) Orange might have completed near the 25100 level. Additionally, Minute Waves ((i)) and ((ii)) (not labelled on the Daily Chart) may have concluded around the 23900 and 24800-50 zones respectively. If this analysis is accurate, a sharp decline from the current levels against the 25100 mark could be anticipated.

Invalidation Point: 25100-50

Nifty 50 Index Elliott Wave Technical Analysis

The Nifty 50 daily chart suggests a potential top around the 25100 mark on August 01, 2024. If correct, this could mark the termination at multiple degrees, including Minor, Intermediate, Primary, and possibly Cycle Wave III. Alternatively, if Minor Wave 5 is extending, 25100 could represent Minute Wave ((i)).

The Nifty 50 may have potentially completed Cycle Wave III since the lows of 2500 in 2009. If this scenario holds, a significant correction could be imminent, moving against the 25100 high. A drop below 23900 would be an initial indication of bearish control.

Should the above wave structure hold, an intermediate target could potentially be around 21300, aligning with Minute Wave 4 of one lesser degree. Alternatively, a rise above 25100 would confirm that Minor Wave 5 is extending.

Nifty-50-Index-1D-St...


NIFTY 50 INDEX – NIFTY (4H Chart) Elliott Wave / Technical Analysis:

Function: Corrective Lower (Minor degree, Grey)

Mode: Corrective

Structure: Potential Impulse within a larger degree Corrective Wave

Position: Potential Minute Wave ((iii))

Details: Minute Wave ((ii)) is unfolding within Minor Wave 1, moving against the 25100 level.

Invalidation Point: 25100-50

Nifty 50 Index 4H Chart Technical Analysis and Potential Elliott Wave Counts:

The Nifty 50 4H chart’s potential wave counts indicate that Minute Waves ((i)) and ((ii)) might have completed around the 23900-30 and 24800-50 zones respectively. If accurate, the index could soon begin moving lower as Wave ((iii)) unfolds. A breach of the 25100 level would invalidate this bearish scenario.

Technical Analyst: Harsh Japee

Source: visit Tradinglounge.com and learn From the Experts Join TradingLounge Here 

Previous: ONGC Elliott Wave Technical Analysis

Special Trial Offer - 0.76 Cents a Day for 3 Months! Click here

Access 7 Analysts Over 200 Markets Covered. Chat Room With Support
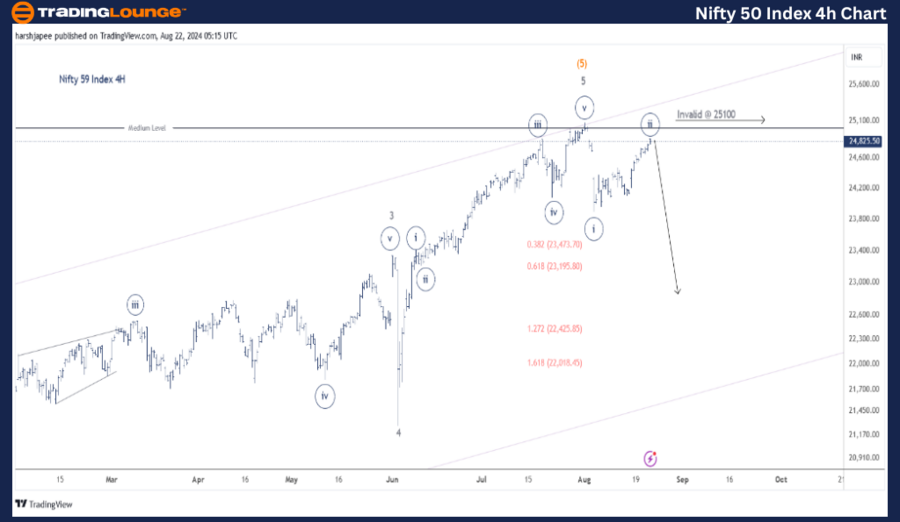
Nifty-50-Index-4h-St...

Conclusion:

The Nifty 50 Index appears poised to resume Minute Wave ((iii)) of Minor Wave 1 lower against the 25100 highs. At the time of writing, a potential right shoulder seems to be forming around the 24800-30 zone.

Related

U.S.Dollar/Swiss Franc(USDCHF) Elliott Wave Analysis: Daily Chart Review - February 2, 2024

U.S.Dollar/Swiss Franc(USDCHF) Elliott Wave Analysis: Daily Chart Review - February 2, 2024

Unlock profitable trading opportunities with expert insights from the latest USDCHF Elliott Wave Ana...

Read More >
Wheat Commodity Elliott Wave Technical Analysis: Key Market Movements and Predictions for Wheat Prices

Wheat Commodity Elliott Wave Technical Analysis: Key Market Movements and Predictions for Wheat Prices

This article delves into the Wheat Elliott Wave Analysis, providing insights into price forecasts an...

Read More >
S&P 500 ELLIOTT WAVE ANALYSIS, 20 JAN 2022

S&P 500 ELLIOTT WAVE ANALYSIS, 20 JAN 2022

S&P500 Expect support at 4500, but eventually expect the market to move through this Minor Level and...

Read More >
S&P 500 ELLIOTT WAVE ANALYSIS, 22 MARCH 2022

S&P 500 ELLIOTT WAVE ANALYSIS, 22 MARCH 2022

SP 500 ELLIOTT WAVE ANALYSIS Stock Indices News: Plus NASDAQ 100 (NDX), Russell 2000 (RUT) & Dow Jon...

Read More >
NEO’s Crypto Market Trends with Accurate Forecasts and Actionable Plans: NEOUSD Elliott Wave Technical Analysis

NEO’s Crypto Market Trends with Accurate Forecasts and Actionable Plans: NEOUSD Elliott Wave Technical Analysis

This analysis provides an in-depth look at NEOUSD using Elliott Wave theory, offering key insights i...

Read More >
Caterpillar Inc. Stocks Elliott Wave Analysis: Detailed Technical Analysis Highlights Potential Targets of $400 and $500 for CAT

Caterpillar Inc. Stocks Elliott Wave Analysis: Detailed Technical Analysis Highlights Potential Targets of $400 and $500 for CAT

This analysis provides a comprehensive look at Caterpillar Inc. (CAT) stock using Elliott Wave theor...

Read More >

Buy 1 Month

Get 3 Months!

Special Offer:

Trade Recommendations

Unleash the power of deversified trading with our comprehensive portfolio, covering:

  • Stock Trades
  • Crypto Trades
  • Forex Trades
  • Commodity Trades
Elliott Wave Analysis

Gain a competive edge with expert insights in to:

  • Global Indices
  • US Stocks & ASX Stocks
  • Forex & Crypto
  • Commodities
Top-Notch Trading Tools

Equip yourself with the tools of success:

  • Social Chat
  • Elliott Wave Algorithm
  • Screener
  • TradingLevels
  • Trading Game
7 Elliott Wave Analysts

Stay ahead of the market with daily charts and insightful videos
-Your secret to strategic trading!

JOIN HERE


Welcome to TradingLounge (ASIC A.R.No. 321187), specialists in trades, trading education and technical analysis, covering stocks, indices, commodities, forex and cryptocurrencies.

When you join TradingLounge you have access to everything we offer, including trade tools, educational content and a social platform to chat with like-minded investors.

Read more

@Copyright 2024 by tradinglounge.com

Contact Us

Australian no: 02 4787 6020

International no: +61 (2) 47876020

Pay with:

Find us on