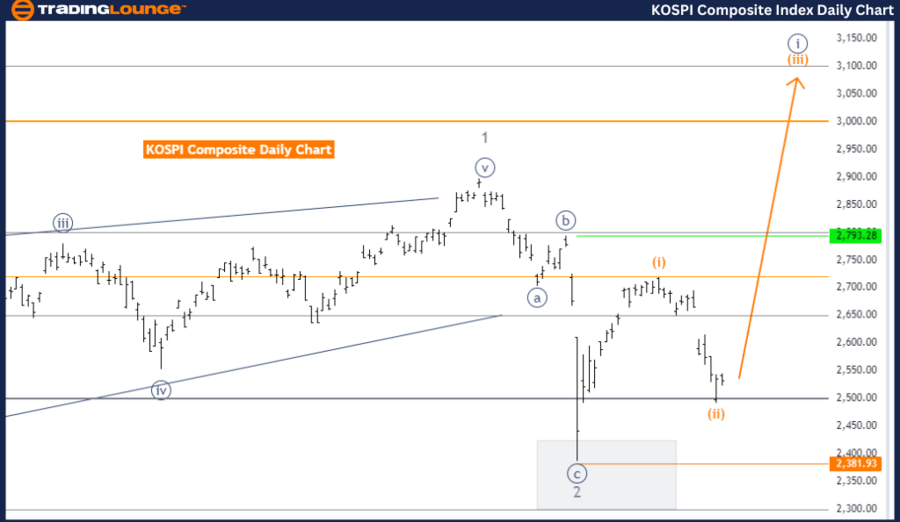
KOSPI Composite Elliott Wave Analysis TradingLounge Day Chart
KOSPI Composite Day Chart Analysis
KOSPI Composite Elliott Wave Technical Analysis
FUNCTION: Bullish Trend
MODE: Impulsive
STRUCTURE: Orange wave 3
POSITION: Navy Blue Wave 1
DIRECTION NEXT HIGHER DEGREES: Orange wave 3 (started)
CANCEL INVALID LEVEL: 2381.93
The KOSPI Composite Elliott Wave analysis on the daily chart signals a bullish trend. The market is in an impulsive mode, suggesting a strong upward movement.
Currently, the structure under review is orange wave 3, with the position in navy blue wave 1, indicating the start of a larger upward trajectory.
At this point, orange wave 2 has been completed, and orange wave 3 has started. This marks a continuation of the bullish trend, pointing towards a further upward price movement. The conclusion of wave 2 indicates a shift from the corrective phase back into an impulsive and bullish phase.
The next higher degrees align with the ongoing orange wave 3, signaling further upward movement in the market. Wave 3, typically the most extended and powerful wave in the Elliott Wave cycle, points to substantial upward momentum.
The critical level to watch is the wave invalidation point at 2381.93. If the price dips below this level, the current Elliott Wave structure would be invalidated, requiring a reassessment of the market trend. However, as long as the price remains above this level, the bullish outlook holds strong, with the potential for continued gains.
In summary, the KOSPI Composite is experiencing a bullish trend with orange wave 3 in progress. The completion of orange wave 2 marks the start of further upward momentum. As long as the price stays above 2381.93, the bullish scenario remains valid.
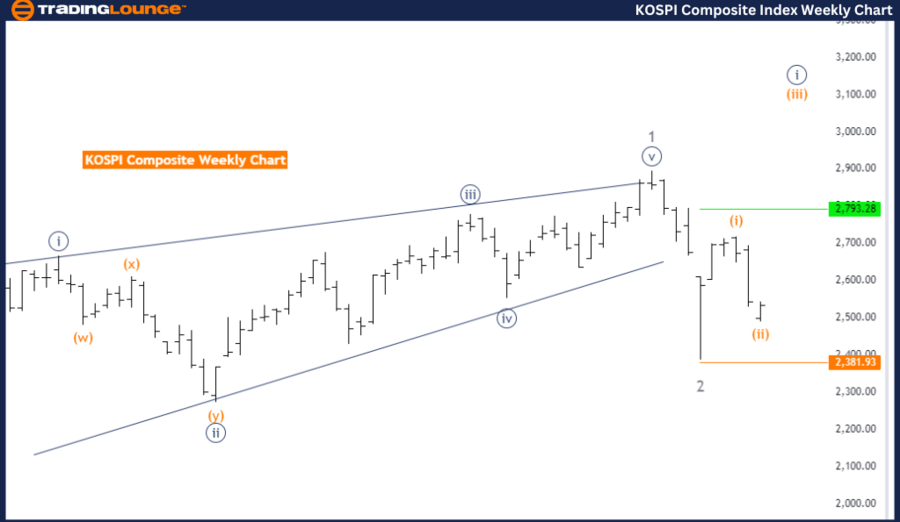
KOSPI Composite Elliott Wave Analysis Trading Lounge Weekly Chart
KOSPI Composite Elliott Wave Technical Analysis
FUNCTION: Bullish Trend
MODE: Impulsive
STRUCTURE: Orange wave 3
POSITION: Navy Blue Wave 1
DIRECTION NEXT HIGHER DEGREES: Orange wave 3 (started)
CANCEL INVALID LEVEL: 2381.93
The KOSPI Composite Elliott Wave analysis on the weekly chart highlights a bullish trend. The market is in impulsive mode, reflecting strong upward momentum. The current structure is orange wave 3, with the position at navy blue wave 1, signaling the early stages of upward movement.
Orange wave 2 has concluded, and orange wave 3 is now underway, reinforcing the bullish momentum. Orange wave 3 is a significant part of the Elliott Wave cycle, often associated with substantial upward price movements, indicating that the market could see significant gains during this phase.
The next higher degrees follow the ongoing orange wave 3, suggesting that the upward trend is likely to continue. Wave 3 is usually the longest and strongest wave in the Elliott Wave sequence, which is vital for confirming the bullish outlook.
A crucial invalidation level is set at 2381.93. If the price drops below this level, the current Elliott Wave structure would be invalidated, casting doubt on the bullish trend. However, as long as the price remains above this point, the bullish trend stays intact, with the potential for further upward movement.
In summary, the KOSPI Composite is in a bullish trend on the weekly chart, with orange wave 3 actively progressing. The completion of orange wave 2 supports the beginning of a new upward phase. As long as the price stays above 2381.93, the bullish outlook remains strong, suggesting continued gains ahead.
Technical Analyst: Malik Awais
Source: visit Tradinglounge.com and learn From the Experts Join TradingLounge Here
Previous: DOW JONES index Elliott Wave Technical Analysis
Special Trial Offer - 0.76 Cents a Day for 3 Months! Click here
Access 7 Analysts Over 200 Markets Covered. Chat Room With Support