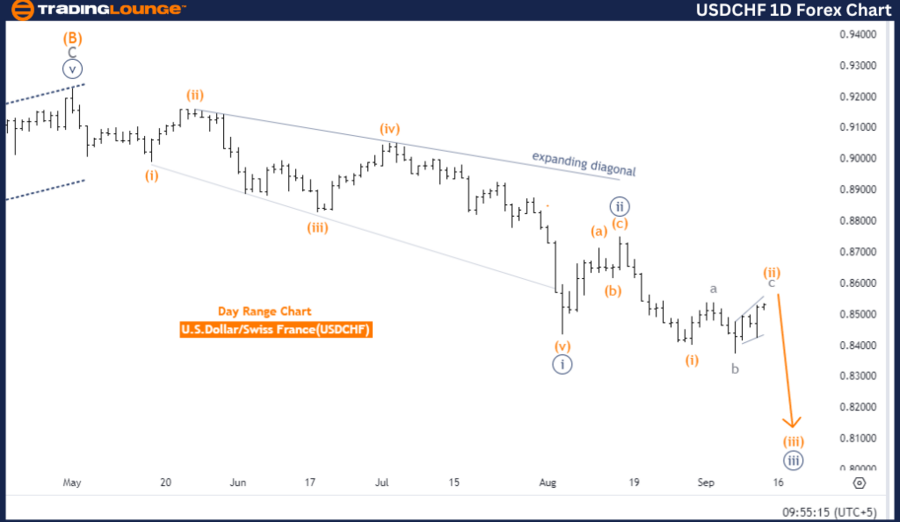
TradingLounge U.S. Dollar / Swiss Franc Currency Pair Analysis - Day Chart
U.S. Dollar / Swiss Franc Pair Day Chart Analysis
USDCHF Elliott Wave Technical Analysis
-
Function: Counter Trend
-
Mode: Corrective
-
Structure: Orange Wave 2
-
Position: Navy Blue Wave 3
-
Next Lower Degree: Orange Wave 3
-
Details: Orange wave 1 is complete, and orange wave 2 is nearing its conclusion.
- Wave Cancel Invalid Level: 0.87486
The Elliott Wave analysis for USDCHF on the daily chart indicates that the pair is currently in a corrective phase. The market is moving in orange wave 2, while positioned in navy blue wave 3. This corrective movement suggests a pause before a more impulsive trend resumes.
Orange wave 1 has already finished, and orange wave 2 is now unfolding. The analysis shows that this corrective phase is approaching its end, potentially leading to the beginning of orange wave 3. Upon the completion of orange wave 2, the market may transition into a stronger trend, which could continue or reverse the existing market direction.
The next anticipated movement is the start of orange wave 3, which is expected to occur once orange wave 2 concludes. Traders are watching closely for this transition as it may signal the market's shift out of its corrective phase and into a more defined trend. This phase will be critical for predicting the future trajectory of USDCHF.
A wave cancellation level is set at 0.87486. If the price falls to or below this level, the current wave count will be invalidated, meaning the corrective wave structure will need to be reevaluated. If the price remains above this level, the market is likely to transition from orange wave 2 into orange wave 3.
Summary: USDCHF is in a corrective phase with orange wave 2 nearing its end. The next expected move is into orange wave 3 unless the price falls below 0.87486.
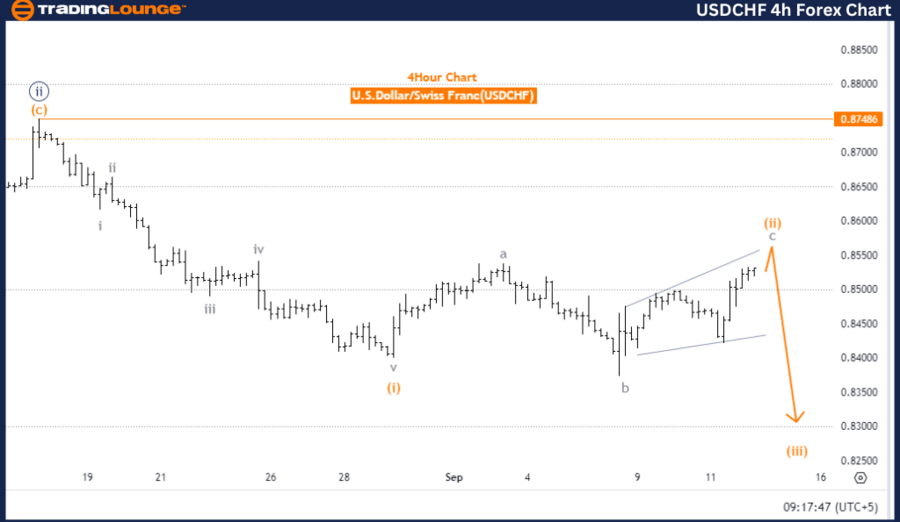
TradingLounge USDCHF Currency Pair Analysis- 4-Hour Chart
U.S. Dollar / Swiss Franc (USDCHF) – 4-Hour Chart
USDCHF Elliott Wave Technical Analysis
-
Function: Counter Trend
-
Mode: Corrective
-
Structure: Orange Wave 2
-
Position: Navy Blue Wave 3
-
Next Lower Degree: Orange Wave 3
-
Details: Orange wave 1 is complete, and orange wave 2 is nearing its conclusion.
- Wave Cancel Invalid Level: 0.87486
The Elliott Wave analysis for USDCHF on the 4-hour chart suggests that the pair is in a corrective phase within orange wave 2, while positioned in navy blue wave 3. This indicates that the market is correcting within a larger trend, with orange wave 2 still unfolding.
Orange wave 1 appears to have finished, and orange wave 2 is currently developing. The analysis points to the nearing conclusion of this wave, implying that the market could soon transition into orange wave 3. Once this transition happens, the market is expected to experience a more impulsive move with stronger directional momentum.
The next wave, orange wave 3, is anticipated to begin after orange wave 2 completes. As traders monitor this transition, the completion of orange wave 2 will be a key indicator of the market’s next direction, either resuming its previous trend or moving into a new phase.
The wave cancellation level is set at 0.87486. If the price falls below this level, the current wave count will become invalid, and the existing wave structure will need to be reassessed. However, if the price remains above this level, the wave count remains valid, with the market expected to transition from orange wave 2 into orange wave 3.
Summary: USDCHF remains in the corrective phase of orange wave 2, which is nearing its end. The next move into orange wave 3 is expected unless the price drops below 0.87486.
Technical Analyst: Malik Awais
Source: visit Tradinglounge.com and learn From the Experts Join TradingLounge Here
Previous: USDJPY Elliott Wave Technical Analysis
Special Trial Offer - 0.76 Cents a Day for 3 Months! Click here
Access 7 Analysts Over 200 Markets Covered. Chat Room With Support