S&P/ASX 200 Elliott Wave Analysis - TradingLounge Day Chart

S&P/ASX 200 Index Day Chart Analysis

S&P/ASX 200 Elliott Wave Technical Analysis

  • Function: Trend

  • Mode: Impulsive

  • Structure: Gray wave 3

  • Position: Orange wave 3

  • Next Lower Degree: Gray wave 4

  • Invalidation Level: 7,625.9

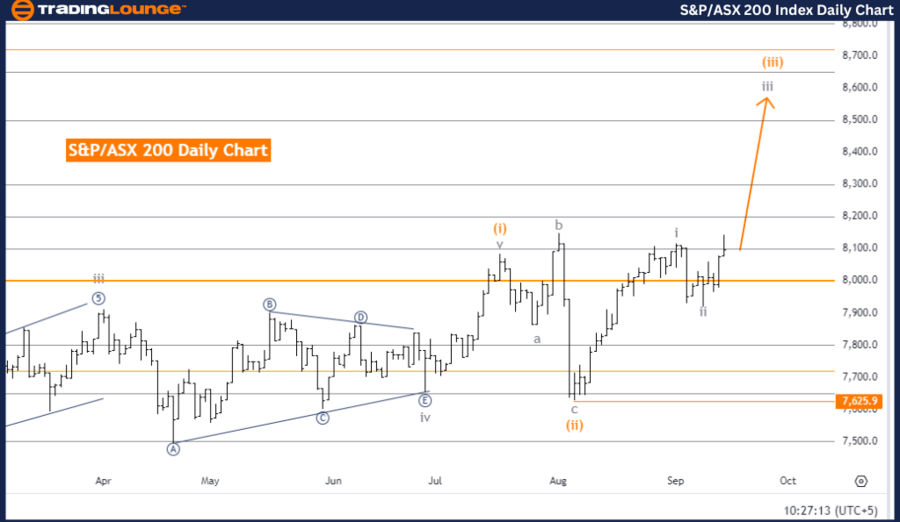
The S&P/ASX 200 Elliott Wave Analysis for the day chart reveals a strong trend with an impulsive wave structure. The focus is on gray wave 3, which indicates continued bullish momentum in the market. The market is currently within orange wave 3, part of the larger gray wave 3, highlighting a positive price movement.

The analysis shows that gray wave 2 is now complete, and gray wave 3 of orange wave 3 is in progress. This transition from the corrective phase to the impulsive phase often results in a strong price surge, aligning with the ongoing upward trend. The next important phase will be the development of gray wave 4, expected after the completion of gray wave 3.

The invalidation level of 7,625.9 serves as a critical threshold. If the market drops below this level, the current wave structure could be compromised, requiring a reevaluation of the market direction.

Summary

The S&P/ASX 200 is experiencing a strong bullish trend, supported by the progression of gray wave 3 and orange wave 3. With gray wave 2 completed and gray wave 3 ongoing, the market is likely to maintain its upward trajectory. Keep an eye on the invalidation level at 7,625.9, which could indicate a shift in the trend if breached.

S&P-ASX-200-Index-Da...


S&P/ASX 200 Elliott Wave Analysis - TradingLounge Weekly Chart

S&P/ASX 200 Elliott Wave Technical Analysis

  • Function: Trend

  • Mode: Impulsive

  • Structure: Orange wave 3

  • Position: Navy Blue Wave 3

  • Next Lower Degree: Orange wave 4

  • Invalidation Level: 7,625.9

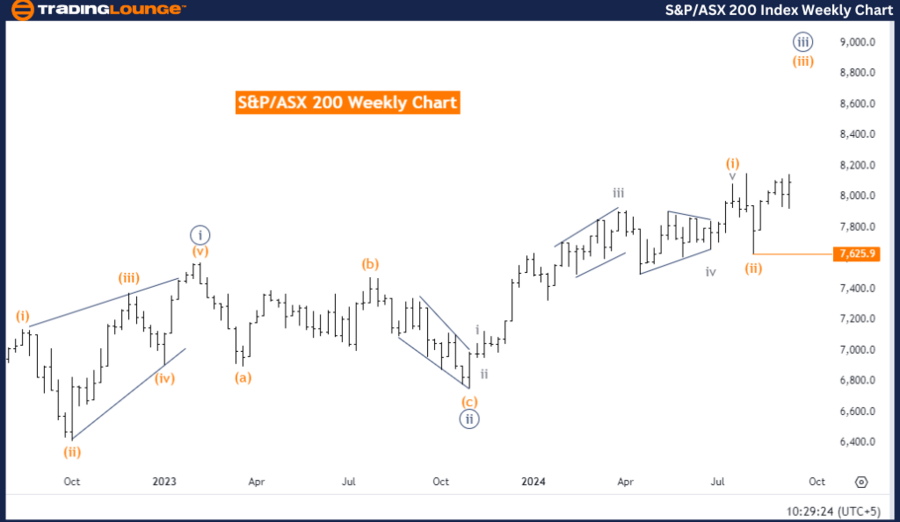
The S&P/ASX 200 Elliott Wave Analysis for the weekly chart indicates a clear upward trend with the market in an impulsive phase. The focus is on orange wave 3, which suggests continued upward momentum. The market is positioned within navy blue wave 3, a higher-degree wave, confirming the bullish outlook.

According to the analysis, orange wave 2 is complete, and the market is progressing through orange wave 3 of navy blue wave 3. This phase is typically marked by significant price increases, often representing the most powerful part of the impulsive wave structure.

The next key phase will be orange wave 4, a corrective wave expected to follow the completion of orange wave 3. Despite this potential correction, the overall trend remains bullish for now.

The invalidation level at 7,625.9 is a crucial point to monitor. A drop below this level could invalidate the current wave structure and prompt a reassessment of the market outlook.

Summary

The S&P/ASX 200 continues in a strong bullish trend with both orange wave 3 and navy blue wave 3 active. The completion of orange wave 2 and the ongoing impulsive phase suggest continued upward movement. However, traders should monitor the invalidation level at 7,625.9, as a breach could signal a shift in the wave structure.

Technical Analyst: Malik Awais

Source: visit Tradinglounge.com and learn From the Experts Join TradingLounge Here 

Previous: CAC 40 index Elliott Wave Technical Analysis

Special Trial Offer - 0.76 Cents a Day for 3 Months! Click here

Access 7 Analysts Over 200 Markets Covered. Chat Room With Support

S&P-TSX-60-Index-Wee...

Related

Comprehensive Elliott Wave Market Analysis: S&P 500, NASDAQ 100, RUSSELL 2000, DAX 40, FTSE 100, ASX 200 Insights

Comprehensive Elliott Wave Market Analysis: S&P 500, NASDAQ 100, RUSSELL 2000, DAX 40, FTSE 100, ASX 200 Insights

In our latest analysis leveraging the Elliott Wave framework, we advise investors to progressively a...

Read More >
Unlock EUR/GBP's Market Potential with Expert Elliott Wave Analysis and Forecast for Stronger Forex Trading Strategies

Unlock EUR/GBP's Market Potential with Expert Elliott Wave Analysis and Forecast for Stronger Forex Trading Strategies

This article provides a thorough Elliott Wave analysis of the EUR/GBP pair, focusing on the latest t...

Read More >
Looking to Buy the Best NASDAQ Stocks or Explore NDX ETFs With NASDAQ Index Elliott Wave Technical Analysis

Looking to Buy the Best NASDAQ Stocks or Explore NDX ETFs With NASDAQ Index Elliott Wave Technical Analysis

Gain valuable insights into NASDAQ Composite trading with our Elliott Wave analysis. Discover expert...

Read More >
 Forex USD/JPY Currency Pair and U.S. Dollar/Japanese Yen (USDJPY) Forex Elliott Wave Technical Analysis

Forex USD/JPY Currency Pair and U.S. Dollar/Japanese Yen (USDJPY) Forex Elliott Wave Technical Analysis

Gain in-depth USD/JPY Elliott Wave analysis knowledge with our comprehensive guide. Learn about curr...

Read More >
Euro Stoxx 50 Index Elliott Wave Technical Analysis Exhibits a Strong Bullish Trend on the Daily and Weekly Chart

Euro Stoxx 50 Index Elliott Wave Technical Analysis Exhibits a Strong Bullish Trend on the Daily and Weekly Chart

The Euro Stoxx 50 index exhibits a strong bullish trend on the weekly chart, with an impulsive Orang...

Read More >
Wheat Commodities: Comprehensive expert  Elliott Wave Technical Analysis of the Wheat Market

Wheat Commodities: Comprehensive expert Elliott Wave Technical Analysis of the Wheat Market

This comprehensive guide provides an expert Elliott Wave Analysis of the Wheat Market for 2024, high...

Read More >

Buy 1 Month

Get 3 Months!

Special Offer:

Trade Recommendations

Unleash the power of deversified trading with our comprehensive portfolio, covering:

  • Stock Trades
  • Crypto Trades
  • Forex Trades
  • Commodity Trades
Elliott Wave Analysis

Gain a competive edge with expert insights in to:

  • Global Indices
  • US Stocks & ASX Stocks
  • Forex & Crypto
  • Commodities
Top-Notch Trading Tools

Equip yourself with the tools of success:

  • Social Chat
  • Elliott Wave Algorithm
  • Screener
  • TradingLevels
  • Trading Game
7 Elliott Wave Analysts

Stay ahead of the market with daily charts and insightful videos
-Your secret to strategic trading!

JOIN HERE


Welcome to TradingLounge (ASIC A.R.No. 321187), specialists in trades, trading education and technical analysis, covering stocks, indices, commodities, forex and cryptocurrencies.

When you join TradingLounge you have access to everything we offer, including trade tools, educational content and a social platform to chat with like-minded investors.

Read more

@Copyright 2024 by tradinglounge.com

Contact Us

Australian no: 02 4787 6020

International no: +61 (2) 47876020

Pay with:

Find us on