Meta Platforms Inc. (META) Elliott Wave Analysis – Bullish Momentum in Focus

Meta Platforms Inc. (META) is showing strong bullish momentum, as demonstrated by Elliott Wave analysis. With the stock rebounding from recent lows and signaling further upward potential, traders are closely watching key targets for the next major rally. In this analysis, we break down META’s wave structure on both the daily and 1-hour charts, focusing on key support and resistance levels, along with actionable insights for traders.

META Elliott Wave Analysis – TradingLounge Daily Chart

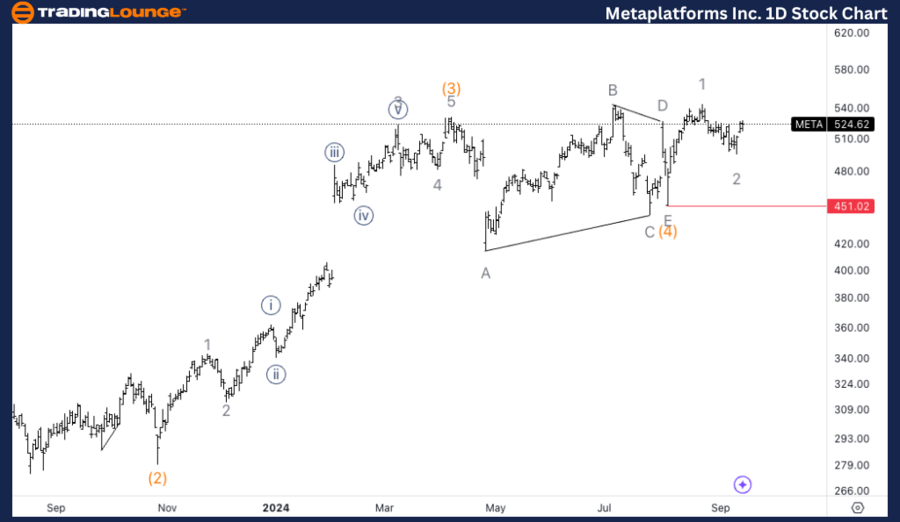
Meta Platforms Inc. (META) Daily Chart Overview

META Elliott Wave Technical Analysis

Function: Trend

Mode: Impulsive

Structure: Motive

Position: Intermediate wave (5)

Direction: Upside in wave 3

Details: After bouncing off the $500 support level, we are looking for the bottom of wave 2 to be in place, with upside targets around the $650 Medium Level.

META Stock Daily Chart Analysis

On the daily chart, META is progressing in Intermediate wave (5), having just completed a wave 2 correction. The stock has rebounded from the $500 support level and is now preparing for a further upward move. The next target on this bullish trajectory is the $650 Medium Level, which serves as a significant resistance point within wave 3. Establishing support at $500 strengthens the case for an ongoing uptrend, signaling that bullish momentum remains intact.

Meta-Platforms-Inc-1...


META Elliott Wave Analysis – TradingLounge 1-Hour Chart

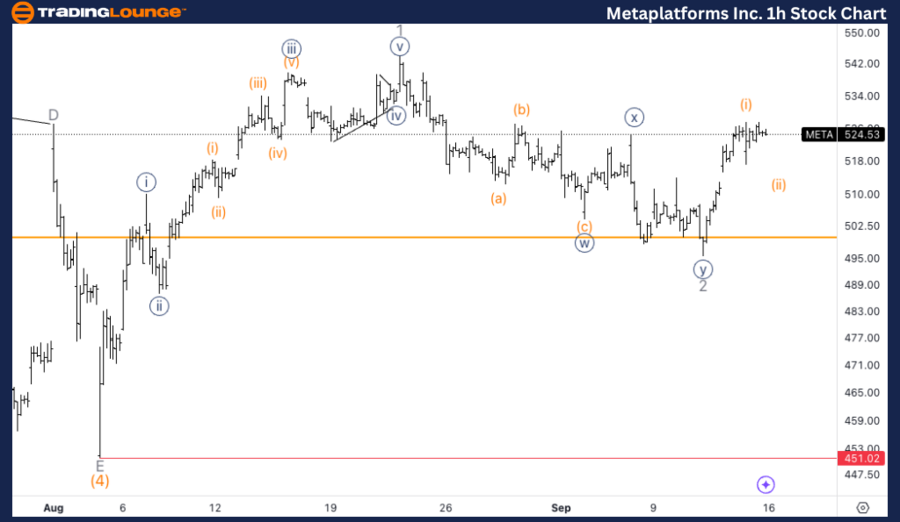
Meta Platforms Inc. (META) 1H Chart Overview

META Elliott Wave Technical Analysis

Function: Trend

Mode: Impulsive

Structure: Motive

Position: Minute wave {i}

Direction: Upside in wave {i}

Details: A potential top in wave (i) of {i} may be forming after breaking the previous wave {b}, with a three-wave pullback expected.

Meta 1-Hour Chart Analysis

The 1-hour chart shows that META is currently in Minute wave {i} within a larger wave structure. After surpassing the previous wave {b} high, the stock appears to be nearing the top of wave (i) of {i}. Traders should anticipate a three-wave pullback in wave (ii), which would act as a correction before the next upward phase. This pullback may present a buying opportunity for those looking to position for further gains in the upcoming wave.

Technical Analyst: Alessio Barretta

Source: visit Tradinglounge.com and learn From the Experts Join TradingLounge Here 

See Previous:McDonald's Corp. (MCD) Elliott Wave Technical Analysis

Special Trial Offer - 0.76 Cents a Day for 3 Months! Click here

Access 7 Analysts Over 200 Markets Covered. Chat Room With Support

Meta-Platforms-Inc-1...

Related

Discover the latest VanEck Semiconductor ETF (SMH) Stocks Elliott Wave Technical Analysis

Discover the latest VanEck Semiconductor ETF (SMH) Stocks Elliott Wave Technical Analysis

Discover the latest Elliott Wave analysis of the VanEck Semiconductor ETF (SMH) as of May 2024. This...

Read More >
Examines NTPC's Recent Price Trends, Support and Resistance Levels: NTPC Stocks Elliott Wave Technical Analysis

Examines NTPC's Recent Price Trends, Support and Resistance Levels: NTPC Stocks Elliott Wave Technical Analysis

This article provides a comprehensive Elliott Wave analysis of NTPC stock, highlighting key price ta...

Read More >
AAVE/ U.S. dollar(AAVEUSD) Elliott Wave Technical Analysis: Explore the corrective phase within the Zigzag pattern

AAVE/ U.S. dollar(AAVEUSD) Elliott Wave Technical Analysis: Explore the corrective phase within the Zigzag pattern

In this Elliott Wave analysis and trading strategy overview for AAVE/USD (AAVEUSD) on February 26, w...

Read More >
ChainLink / U.S. dollar(LINKUSD) Elliott Wave Technical Analysis 2 November 23

ChainLink / U.S. dollar(LINKUSD) Elliott Wave Technical Analysis 2 November 23

Chainlink/U.S. dollar (LINKUSD) Elliott Wave Technical Analysis for 2 November 23, Elliott Wave Anal...

Read More >
Costco Wholesale Corp.(COST:NASDAQ) Elliott Wave Technical Analysis 7 November 23

Costco Wholesale Corp.(COST:NASDAQ) Elliott Wave Technical Analysis 7 November 23

Costco Wholesale Corp.(COST:NASDAQ) Elliott Wave Technical Analysis on 7 November 23, COST Stock Mar...

Read More >
Accurate Dogecoin Crypto Price Technical Analysis and Forecast your next Trade Effectively: DOGEUSD Elliott Wave Analysis

Accurate Dogecoin Crypto Price Technical Analysis and Forecast your next Trade Effectively: DOGEUSD Elliott Wave Analysis

In this comprehensive analysis of Dogecoin (DOGEUSD) using Elliott Wave theory, we provide insights ...

Read More >

Buy 1 Month

Get 3 Months!

Special Offer:

Trade Recommendations

Unleash the power of deversified trading with our comprehensive portfolio, covering:

  • Stock Trades
  • Crypto Trades
  • Forex Trades
  • Commodity Trades
Elliott Wave Analysis

Gain a competive edge with expert insights in to:

  • Global Indices
  • US Stocks & ASX Stocks
  • Forex & Crypto
  • Commodities
Top-Notch Trading Tools

Equip yourself with the tools of success:

  • Social Chat
  • Elliott Wave Algorithm
  • Screener
  • TradingLevels
  • Trading Game
7 Elliott Wave Analysts

Stay ahead of the market with daily charts and insightful videos
-Your secret to strategic trading!

JOIN HERE


Welcome to TradingLounge (ASIC A.R.No. 321187), specialists in trades, trading education and technical analysis, covering stocks, indices, commodities, forex and cryptocurrencies.

When you join TradingLounge you have access to everything we offer, including trade tools, educational content and a social platform to chat with like-minded investors.

Read more

@Copyright 2024 by tradinglounge.com

Contact Us

Australian no: 02 4787 6020

International no: +61 (2) 47876020

Pay with:

Find us on