BHARTI AIRTEL – BHARTIARTL Elliott Wave Analysis (1D Chart)

Function: Larger Degree Trend Higher (Intermediate degree, orange)

Mode: Motive

Structure: Impulse

Position: Minute Wave ((iii)) Navy

Details: Minute Wave ((iii)) Navy appears complete near the 1650-55 range. If correct, anticipate a corrective Wave ((iv)) Navy before the next upward move. Alternatively, Wave 5 Grey of Intermediate (5) may now be complete.

Invalidation point: 1423

Bharti Airtel Elliott Wave Technical Analysis

Bharti Airtel Daily Chart Technical Analysis and Potential Elliott Wave Counts:

The Bharti Airtel daily chart recorded a new high around the 1600-50 range on September 13, 2024. This high could signify the completion of Minute Wave ((iii)) Navy, as bearish pressure may push prices lower in the near term. Watch for support near the 1500-50 range before a potential final upward push.

Bharti Airtel has been in a steady uptrend since August 2023, after hitting lows around the 850 mark, which completed Intermediate Wave (4) Orange. Minor Wave 4 finished around 1225 on June 04, 2024, with Minor Wave 5 progressing since then.

In the near term, the stock may pull back towards the 1500-50 range before attempting to reach new highs above 1650, completing Minor Wave 5 Grey. Alternatively, Minor Wave 5 might have completed around the recent high (1600-50), indicating that prices may soon resume their downward trajectory.

Bharti-Airtel-1D-Sto...


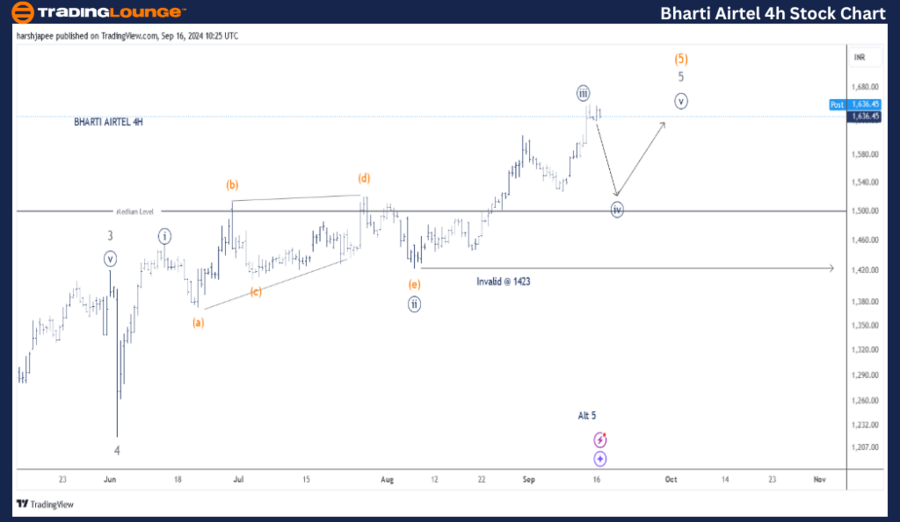
BHARTI AIRTEL – BHARTIARTL (4H Chart) Elliott Wave Analysis

Function: Larger Degree Trend Higher (Intermediate degree, orange)

Mode: Motive

Structure: Impulse

Position: Minute Wave ((iii)) Navy

Details: Minute Wave ((iii)) Navy of Minor Wave 5 Grey appears complete near the 1650-55 range. If correct, expect a corrective Wave ((iv)) Navy before the next upward move. Alternatively, Wave 5 Grey of Intermediate (5) may now be complete.

Invalidation point: 1423

Bharti Airtel 4H Chart Technical Analysis and Potential Elliott Wave Counts:

The Bharti Airtel 4H chart outlines the sub-waves within Minor Wave 5 Grey. Minute Wave ((ii)) formed a potential triangle pattern, while Wave ((iii)) seems complete around 1650. If this is accurate, expect bearish control in the near term to form Minute Wave ((iv)).

Technical Analyst: Harsh Japee

Source: visit Tradinglounge.com and learn From the Experts Join TradingLounge Here 

Previous: HERO MOTO CORP Elliott Wave Technical Analysis 

Special Trial Offer - 0.76 Cents a Day for 3 Months! Click here

Access 7 Analysts Over 200 Markets Covered. Chat Room With Support

Bharti-Airtel-4h-Sto...


Conclusion:

Bharti Airtel could decline to form Minute Wave ((iv)) Navy near the 1500-50 range before resuming its upward trend toward 1650, as bulls prepare for the final push.

Related

Understanding Daily and 4Hr Chart Trends: UnitedHealth Group Inc. (UNH) Elliott Wave Technical Analysis

Understanding Daily and 4Hr Chart Trends: UnitedHealth Group Inc. (UNH) Elliott Wave Technical Analysis

UnitedHealth Group Inc. (UNH) presents intriguing opportunities for traders amidst its ongoing corre...

Read More >
Polkadot / U.S. dollar(DOTUSD) Elliott Wave Technical Analysis 1 December 23

Polkadot / U.S. dollar(DOTUSD) Elliott Wave Technical Analysis 1 December 23

Polkadot / U.S. dollar(DOTUSD) Elliott Wave Technical Analysis dated 1 December 23, DOTUSD Crypto An...

Read More >
GBPUSD Forex Elliott Wave Analysis: Expert Insights on Technical Trends, Invalidation Levels, and Ongoing Price Action

GBPUSD Forex Elliott Wave Analysis: Expert Insights on Technical Trends, Invalidation Levels, and Ongoing Price Action

This article provides a detailed GBPUSD Elliott Wave analysis for both daily and 4-hour charts. It h...

Read More >
Euro/U.S. Dollar (EURUSD) Forex Elliott Wave Technical Analysis: Counter-Trend Movements, Invalidation Levels, and Trading Strategies

Euro/U.S. Dollar (EURUSD) Forex Elliott Wave Technical Analysis: Counter-Trend Movements, Invalidation Levels, and Trading Strategies

Explore detailed EURUSD Elliott Wave analysis for daily and 4-hour charts. Learn about wave counts, ...

Read More >
Currency Pair Australian Dollar and Japanese Yen (AUDJPY) Elliott Wave Technical Analysis and Forex Signals

Currency Pair Australian Dollar and Japanese Yen (AUDJPY) Elliott Wave Technical Analysis and Forex Signals

Our comprehensive AUDJPY Elliott Wave analysis provides valuable insights into market trends, correc...

Read More >
Investing in Stocks, ETFs, or index funds: S&P 500 Index Elliott Wave Technical Analysis for Bullish and Bearish Markets

Investing in Stocks, ETFs, or index funds: S&P 500 Index Elliott Wave Technical Analysis for Bullish and Bearish Markets

Explore in-depth S&P 500 Elliott Wave analysis with a focus on trading strategies and investment tip...

Read More >
Understanding Daily and 4Hr Chart Trends: UnitedHealth Group Inc. (UNH) Elliott Wave Technical Analysis

Understanding Daily and 4Hr Chart Trends: UnitedHealth Group Inc. (UNH) Elliott Wave Technical Analysis

UnitedHealth Group Inc. (UNH) presents intriguing opportunities for traders amidst its ongoing corre...

Read More >
Polkadot / U.S. dollar(DOTUSD) Elliott Wave Technical Analysis 1 December 23

Polkadot / U.S. dollar(DOTUSD) Elliott Wave Technical Analysis 1 December 23

Polkadot / U.S. dollar(DOTUSD) Elliott Wave Technical Analysis dated 1 December 23, DOTUSD Crypto An...

Read More >
GBPUSD Forex Elliott Wave Analysis: Expert Insights on Technical Trends, Invalidation Levels, and Ongoing Price Action

GBPUSD Forex Elliott Wave Analysis: Expert Insights on Technical Trends, Invalidation Levels, and Ongoing Price Action

This article provides a detailed GBPUSD Elliott Wave analysis for both daily and 4-hour charts. It h...

Read More >
Euro/U.S. Dollar (EURUSD) Forex Elliott Wave Technical Analysis: Counter-Trend Movements, Invalidation Levels, and Trading Strategies

Euro/U.S. Dollar (EURUSD) Forex Elliott Wave Technical Analysis: Counter-Trend Movements, Invalidation Levels, and Trading Strategies

Explore detailed EURUSD Elliott Wave analysis for daily and 4-hour charts. Learn about wave counts, ...

Read More >
Currency Pair Australian Dollar and Japanese Yen (AUDJPY) Elliott Wave Technical Analysis and Forex Signals

Currency Pair Australian Dollar and Japanese Yen (AUDJPY) Elliott Wave Technical Analysis and Forex Signals

Our comprehensive AUDJPY Elliott Wave analysis provides valuable insights into market trends, correc...

Read More >
Investing in Stocks, ETFs, or index funds: S&P 500 Index Elliott Wave Technical Analysis for Bullish and Bearish Markets

Investing in Stocks, ETFs, or index funds: S&P 500 Index Elliott Wave Technical Analysis for Bullish and Bearish Markets

Explore in-depth S&P 500 Elliott Wave analysis with a focus on trading strategies and investment tip...

Read More >

Buy 1 Month

Get 3 Months!

Special Offer:

Trade Recommendations

Unleash the power of deversified trading with our comprehensive portfolio, covering:

  • Stock Trades
  • Crypto Trades
  • Forex Trades
  • Commodity Trades
Elliott Wave Analysis

Gain a competive edge with expert insights in to:

  • Global Indices
  • US Stocks & ASX Stocks
  • Forex & Crypto
  • Commodities
Top-Notch Trading Tools

Equip yourself with the tools of success:

  • Social Chat
  • Elliott Wave Algorithm
  • Screener
  • TradingLevels
  • Trading Game
7 Elliott Wave Analysts

Stay ahead of the market with daily charts and insightful videos
-Your secret to strategic trading!

JOIN HERE


Welcome to TradingLounge (ASIC A.R.No. 321187), specialists in trades, trading education and technical analysis, covering stocks, indices, commodities, forex and cryptocurrencies.

When you join TradingLounge you have access to everything we offer, including trade tools, educational content and a social platform to chat with like-minded investors.

Read more

@Copyright 2024 by tradinglounge.com

Contact Us

Australian no: 02 4787 6020

International no: +61 (2) 47876020

Pay with:

Find us on