Wheat Elliott Wave Technical Analysis

Wheat prices are currently undergoing a pullback after rallies observed in August and early September. Since reaching a low in July 2024, wheat has surged over 11%. Despite this corrective rally, the overall trend remains bearish, suggesting that the sell-off could continue later in the year.

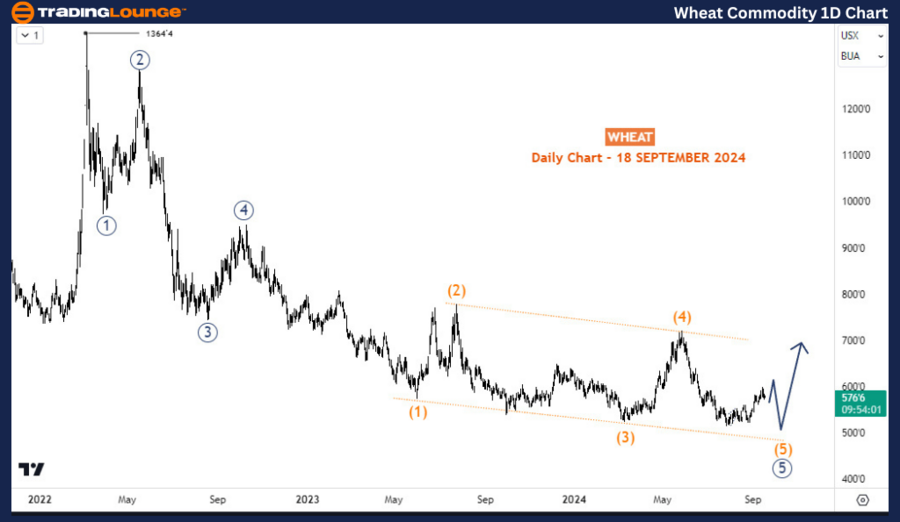
TradingLounge Wheat Commodity Daily Chart Analysis

In the daily chart, the bearish trend appears to be completing an impulse wave sequence that began in March 2022, when wheat prices peaked at 1364. The current analysis suggests the bearish impulse structure is nearing its end. Specifically, the fifth wave—labeled wave 5 (circled) of the primary degree—is forming an ending diagonal pattern. This diagonal is part of wave (5), which is expected to consist of three sub-waves. At present, wave (5) is in its second phase, wave B, which reflects the recent bounce from the July low. Once this wave structure completes, a further decline is anticipated, marking the final leg as wave C of (5). After the conclusion of wave (5), prices are projected to retrace the entire downward move that started from 1366, potentially spanning several months.

Wheat-COMMODITY-1D-C...


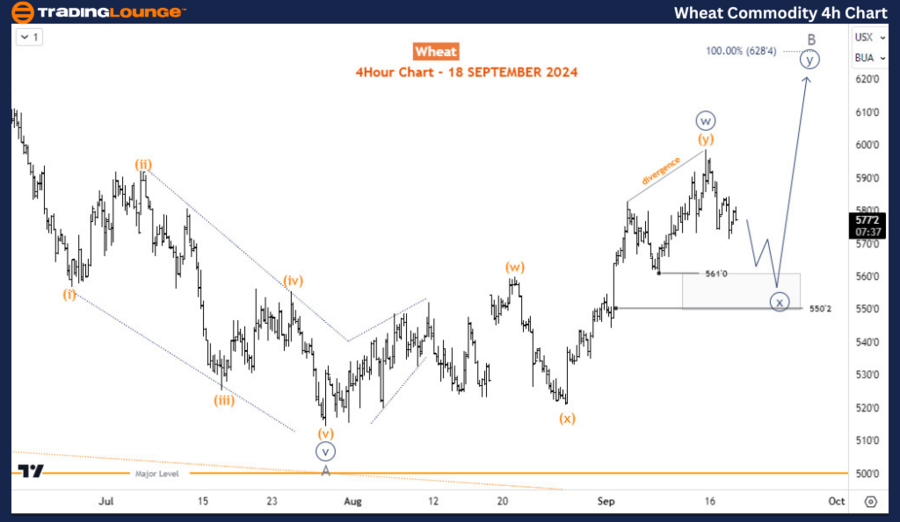
TradingLounge Wheat Commodity H4 Chart Analysis

The H4 chart provides a closer look at the ongoing bounce from July 2024, identified as wave B of (5). A double zigzag structure seems to have formed, potentially representing wave w (circled) of B, or it may indicate the completion of wave B itself. If the recent dip from September 13 holds above the critical support zone between 550 and 561, the upward extension of wave B could continue. On the other hand, if the current bearish move is impulsive and breaks below 550, it would suggest that wave B has already concluded, signaling the start of a downtrend in wave C of (5). Monitoring these key support levels is essential to determine the future direction of wheat prices.

Technical Analyst: Sanmi Adeagbo

Source: visit Tradinglounge.com and learn From the Experts Join TradingLounge Here 

See Previous: Copper Elliott Wave Technical Analysis 

Special Trial Offer - 0.76 Cents a Day for 3 Months! Click here

Access 7 Analysts Over 200 Markets Covered. Chat Room With Support

Wheat-COMMODITY-4H-C...

Related

S&P/TSX 60 Index Elliott Wave Technical Analysis Shows Reinforcing the overall Bullish Outlook in both Daily and Weekly Charts

S&P/TSX 60 Index Elliott Wave Technical Analysis Shows Reinforcing the overall Bullish Outlook in both Daily and Weekly Charts

The S&P/TSX 60 is in a bullish trend, according to Elliott Wave analysis. Gray wave 2 of orange wave...

Read More >
Capitalize on the Ongoing Trends in the NZDUSD Currency Pair: New Zealand Dollar/ U.S. Dollar Elliott Wave Technical Analysis

Capitalize on the Ongoing Trends in the NZDUSD Currency Pair: New Zealand Dollar/ U.S. Dollar Elliott Wave Technical Analysis

Delve into our comprehensive NZDUSD Elliott Wave analysis, focusing on both daily and 4-hour charts....

Read More >
Stay Informed on the NEWMONT CORPORATION ASX Stock - NEM Stock Analysis & Elliott Wave Technical Forecast

Stay Informed on the NEWMONT CORPORATION ASX Stock - NEM Stock Analysis & Elliott Wave Technical Forecast

This article provides an in-depth Elliott Wave Analysis of Newmont Corporation (NEM) on the Australi...

Read More >
U.S.Dollar/Swiss Franc(USDCHF) Elliott Wave Analysis: Daily Chart Review - February 2, 2024

U.S.Dollar/Swiss Franc(USDCHF) Elliott Wave Analysis: Daily Chart Review - February 2, 2024

Unlock profitable trading opportunities with expert insights from the latest USDCHF Elliott Wave Ana...

Read More >
Cardano Crypto Price News Today: Our Detailed Elliott Wave Technical Analysis ADAUSD Provides Detailed Insights

Cardano Crypto Price News Today: Our Detailed Elliott Wave Technical Analysis ADAUSD Provides Detailed Insights

Our detailed Elliott Wave Analysis for Cardano (ADAUSD) provides comprehensive insights into price p...

Read More >
Elliott Wave Analysis: Long Trades,  S&P 500, NASDAQ 100, RUSSELL 2000, DAX 40, FTSE 100, ASX 200.

Elliott Wave Analysis: Long Trades, S&P 500, NASDAQ 100, RUSSELL 2000, DAX 40, FTSE 100, ASX 200.

Elliott Wave Analysis points towards an upward movement in major indices like the S&P 500, NASDAQ 10...

Read More >

Buy 1 Month

Get 3 Months!

Special Offer:

Trade Recommendations

Unleash the power of deversified trading with our comprehensive portfolio, covering:

  • Stock Trades
  • Crypto Trades
  • Forex Trades
  • Commodity Trades
Elliott Wave Analysis

Gain a competive edge with expert insights in to:

  • Global Indices
  • US Stocks & ASX Stocks
  • Forex & Crypto
  • Commodities
Top-Notch Trading Tools

Equip yourself with the tools of success:

  • Social Chat
  • Elliott Wave Algorithm
  • Screener
  • TradingLevels
  • Trading Game
7 Elliott Wave Analysts

Stay ahead of the market with daily charts and insightful videos
-Your secret to strategic trading!

JOIN HERE


Welcome to TradingLounge (ASIC A.R.No. 321187), specialists in trades, trading education and technical analysis, covering stocks, indices, commodities, forex and cryptocurrencies.

When you join TradingLounge you have access to everything we offer, including trade tools, educational content and a social platform to chat with like-minded investors.

Read more

@Copyright 2024 by tradinglounge.com

Contact Us

Australian no: 02 4787 6020

International no: +61 (2) 47876020

Pay with:

Find us on