Australian Dollar/U.S. Dollar (AUDUSD) - TradingLounge Day Chart
Australian Dollar/U.S. Dollar Day Chart Analysis
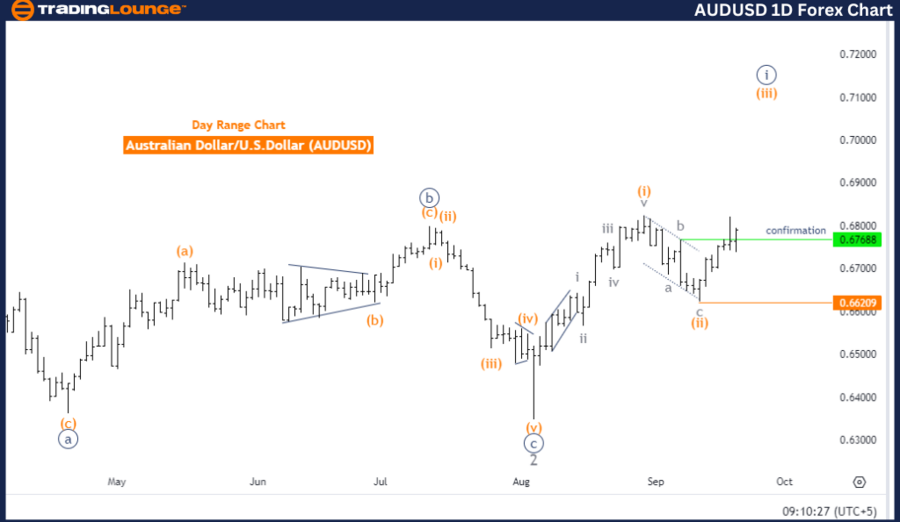
AUDUSD Elliott Wave Technical Analysis
Function: Bullish Trend
Mode: Impulsive
Structure: Orange wave 3
Position: Navy blue wave 1
Direction (Next Higher Degrees): Orange wave 3 (in progress)
Invalidation Level: 0.66209
The Elliott Wave analysis of AUDUSD on the daily chart reveals a bullish trend. The market is currently in an impulsive mode, which indicates a strong movement following the overall trend direction.
The key structure under analysis is orange wave 3, which is already underway. Presently, the price is within navy blue wave 1, a smaller sub-wave nested inside the larger structure of orange wave 3.
Details:
This analysis suggests that orange wave 2 has completed, and the market is now progressing through orange wave 3. This implies that the corrective phase has ended, and the market is resuming its upward movement. The impulsive wave is expected to continue pushing the pair higher, in alignment with the larger bullish trend.
As long as the price stays above the invalidation level of 0.66209, the current Elliott Wave count remains valid, signaling further upward movement.
Summary:
- Trend: Bullish
- Current Structure: Orange wave 3 (in progress)
- Completed Phase: Orange wave 2
- Expected Movement: Continued upward
- Invalidation Level: 0.66209
If the price remains above the invalidation level, the bullish scenario stays intact, suggesting the market will continue its upward movement within the impulsive wave structure.
Australian Dollar/U.S. Dollar (AUDUSD) - TradingLounge 4 Hour Chart
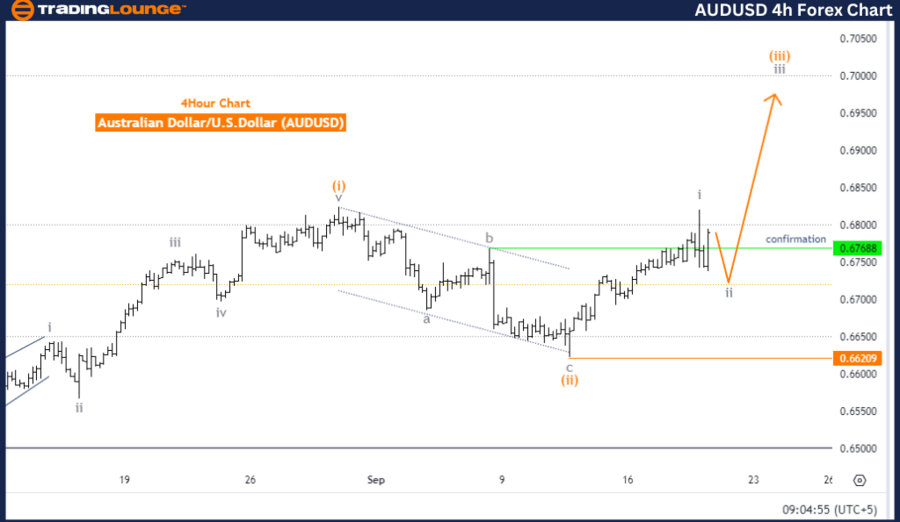
AUDUSD Currency Pair Technical Analysis
Function: Counter Trend
Mode: Corrective
Structure: Gray wave 2
Position: Orange wave 3
Direction (Next Higher Degrees): Gray wave 3
Invalidation Level: 0.66209
On the 4-hour chart, the AUDUSD Elliott Wave analysis indicates that the market is in a counter-trend phase, moving against the larger bullish trend. This corrective mode suggests that the current movement is a temporary retracement within the broader trend.
The structure under review is gray wave 2, which follows the completion of gray wave 1. This suggests that the initial impulsive movement (gray wave 1) has ended, and the market is now in gray wave 2, which represents a corrective phase. During this phase, the price may consolidate or retrace before the next impulsive wave begins.
Details:
The next anticipated movement is gray wave 3, which will resume the broader trend once gray wave 2 concludes. Currently, the market is positioned within orange wave 3, a sub-wave of the gray wave 2 corrective structure. This indicates that after gray wave 1 completed, orange wave 3 is unfolding as part of the larger corrective wave.
The invalidation level remains at 0.66209. Should the price fall below this level, the current Elliott Wave count will be invalidated, requiring a reassessment of the wave pattern.
Summary:
- Trend: Counter-trend (Corrective)
- Current Structure: Gray wave 2 (in progress)
- Completed Phase: Gray wave 1
- Expected Movement: Gray wave 3 (after gray wave 2 completes)
- Invalidation Level: 0.66209
If the price holds above the invalidation level, the corrective structure remains valid, with gray wave 3 expected to resume the broader trend once gray wave 2 concludes.
Technical Analyst: Malik Awais
Source: visit Tradinglounge.com and learn From the Experts Join TradingLounge Here
Previous: Euro/British Pound (EURGBP) Elliott Wave Technical Analysis
VALUE Offer - Buy 1 Month & Get 3 Months! Click here
Access 7 Analysts Over 200 Markets Covered. Chat Room With Support