28Nov

Eli Lilly & Co.(LLY:NYSE) Elliott Wave Technical Analysis 28 November 23

Eli Lilly & Co., Elliott Wave Technical Analysis

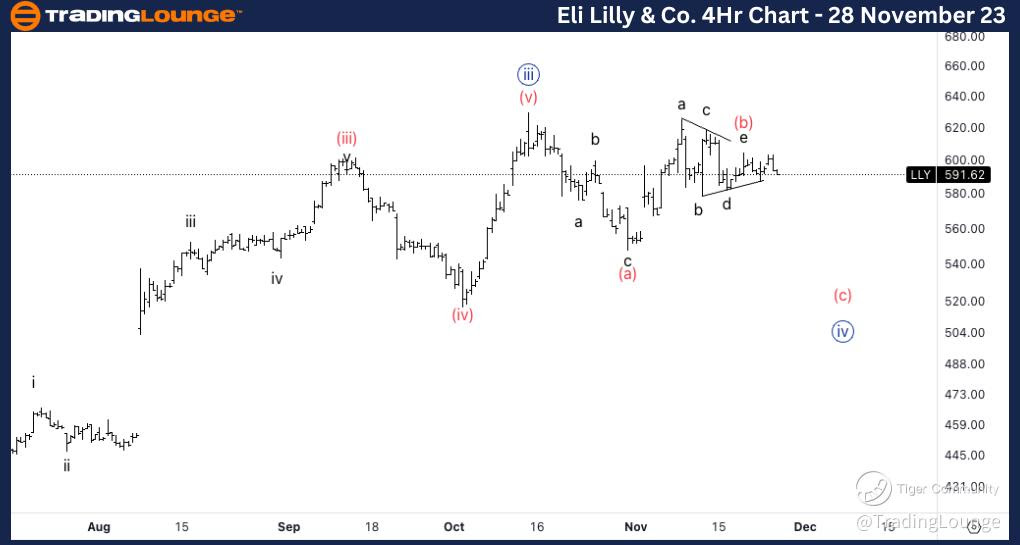
Eli Lilly & Co., (LLY:NYSE): 4h Chart 28 November 23

LLY Stock Market Analysis: Looking for triangle in wave (b) as we seem to be near the end of the correction. There is a potential head and shoulder pattern which would furthermore confer the count.  

LLY Elliott Wave Count: Wave (b) of {iv}.

LLY Technical Indicators: Below 20EMA.s

LLY Trading Strategy: Looking for shorts into wave (c) on 580$ tested resistance.

TradingLounge Analyst: Alessio Barretta

Source: Tradinglounge.com get trial here!
Eli-Lilly-4Hr-stock-...


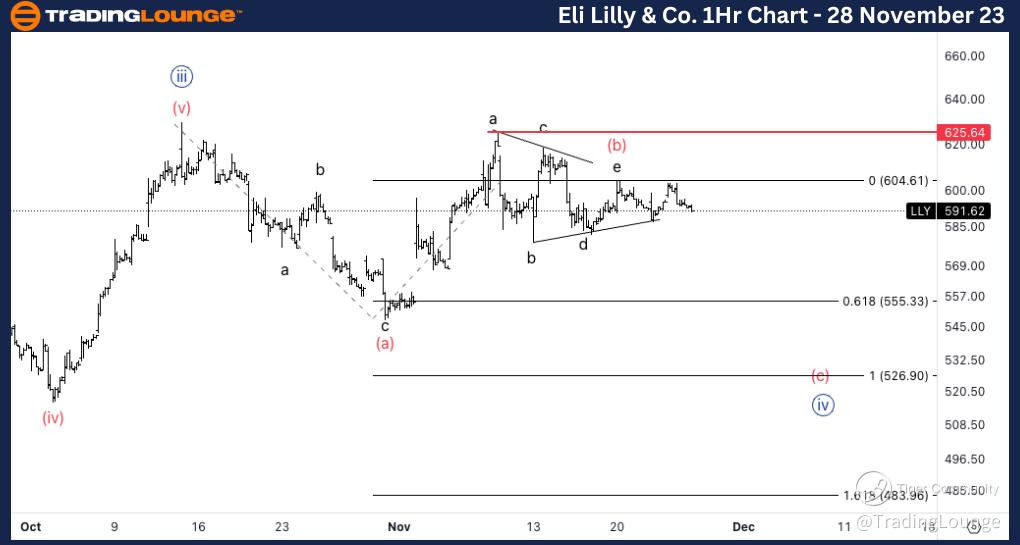
Eli Lilly & Co., LLY: 1-hour Chart 28 November 23

Eli Lilly & Co., Elliott Wave Technical Analysis 

LLY Stock Market Analysis: Looking for further continuation lower, with invalidation level standing at 625$.  

LLY Elliott Wave count:  Wave e of (b).

LLY Technical Indicators: Between averages.

LLY Trading Strategy: Looking for shorts into wave (c) on 580$ tested resistance.
Eli-Lilly-1Hr-stock-...

Related

British Pound/ Australian Dollar(GBPAUD) Elliott Wave Technical Analysis 8 November 23

British Pound/ Australian Dollar(GBPAUD) Elliott Wave Technical Analysis 8 November 23

GBPAUD Elliott Wave Analysis Trading Lounge Day and 4-hour Chart for 8 November 23, delves into the ...

Read More >
Soybean Price Analysis: SoyBeans Elliott Wave Technical Analysis, Signals Recovery Amidst Potential Sell-Off

Soybean Price Analysis: SoyBeans Elliott Wave Technical Analysis, Signals Recovery Amidst Potential Sell-Off

Amidst a recent recovery in Soybean prices, Elliott wave analysis reveals a complex picture hinting ...

Read More >
Exxon Mobil Inc. Stocks Elliott Wave Technical Analysis: Focusing XOM Stcok Market Behavior with chart Analysis

Exxon Mobil Inc. Stocks Elliott Wave Technical Analysis: Focusing XOM Stcok Market Behavior with chart Analysis

Discover our latest Elliott Wave analysis for Exxon Mobil Inc. (XOM) as of June 10, 2024. This compr...

Read More >
"Comprehensive Commodity Market Elliott Wave Analysis: Bitcoin, ETH/USD, Gold, Silver, and More"

"Comprehensive Commodity Market Elliott Wave Analysis: Bitcoin, ETH/USD, Gold, Silver, and More"

Commodity Market Elliott Wave Analysis Summary - Bitcoin (BTC) and ETH/USD: Tracking Wave v) of 1 o...

Read More >
Day and 4-hour Chart for British Pound/U.S.Dollar (GBPUSD) Elliott Wave Technical Analysis

Day and 4-hour Chart for British Pound/U.S.Dollar (GBPUSD) Elliott Wave Technical Analysis

Our GBP/USD Elliott Wave Analysis for the 4-hour chart on 13 March 24 suggests an ongoing impulsive ...

Read More >

Buy 1 Month

Get 3 Months!

Special Offer:

Trade Recommendations

Unleash the power of deversified trading with our comprehensive portfolio, covering:

  • Stock Trades
  • Crypto Trades
  • Forex Trades
  • Commodity Trades
Elliott Wave Analysis

Gain a competive edge with expert insights in to:

  • Global Indices
  • US Stocks & ASX Stocks
  • Forex & Crypto
  • Commodities
Top-Notch Trading Tools

Equip yourself with the tools of success:

  • Social Chat
  • Elliott Wave Algorithm
  • Screener
  • TradingLevels
  • Trading Game
7 Elliott Wave Analysts

Stay ahead of the market with daily charts and insightful videos
-Your secret to strategic trading!

JOIN HERE


Welcome to TradingLounge (ASIC A.R.No. 321187), specialists in trades, trading education and technical analysis, covering stocks, indices, commodities, forex and cryptocurrencies.

When you join TradingLounge you have access to everything we offer, including trade tools, educational content and a social platform to chat with like-minded investors.

Read more

@Copyright 2024 by tradinglounge.com

Contact Us

Australian no: 02 4787 6020

International no: +61 (2) 47876020

Pay with:

Find us on