COAL INDIA LTD – COALINDIA (1D Chart) Elliott Wave Analysis

COAL INDIA Elliott Wave Technical Analysis

Function: Counter Trend Lower (Minor degree, Grey)

Mode: Corrective

Structure: Potential impulse within a larger degree correction

Position: Lower degree Wave ((iv)) – Not labelled on the daily chart

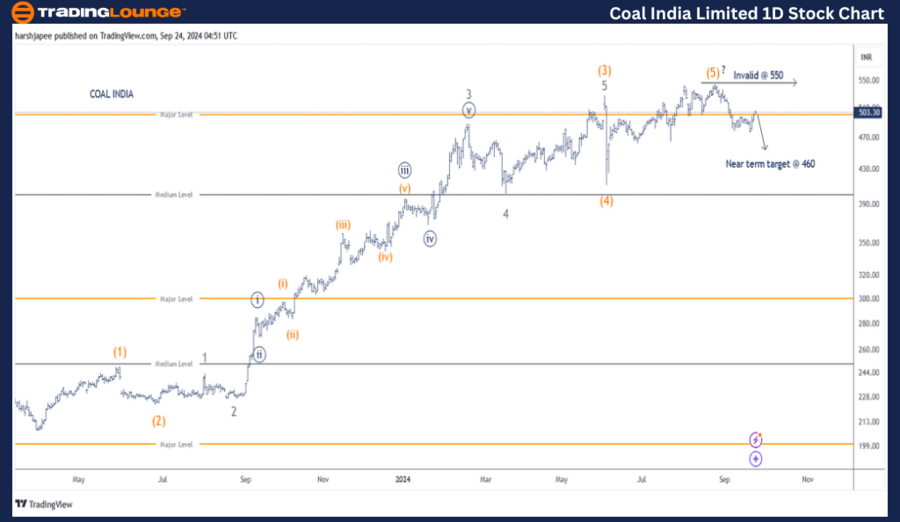
Details: As previously discussed, the alternative wave count may have shifted to the preferred one, with a potential top forming near 550, marking the end of Intermediate Wave (5) Orange. If this wave count is correct, the near-term target could be around 460.

Invalidation Point: 550

COAL INDIA Daily Chart Technical Analysis and Potential Elliott Wave Counts:

The daily chart for COAL INDIA suggests a possible trend reversal, with a potential top at 550, where Intermediate Wave (5) Orange is highlighted. Prices could decline towards the 460 level in the near term to complete the impulse at Minor Degree.

Since hitting a low of 206 in March 2023, COAL INDIA has moved upward, subdividing into Intermediate Waves (1) through (5) Orange. The recent high around 545-550 could represent the completion of Wave (5) Orange, followed by a sharp downward reversal.

If this wave count holds true, bearish control may persist, keeping prices below 550 and potentially driving them to the 460 mark. A break above 550 would invalidate this wave count and suggest a different structure.
Coal-India-Ltd-1D-St...


COAL INDIA LTD – COALINDIA (4H Chart) Elliott Wave Technical Analysis

Function: Counter Trend Lower (Minor degree, Grey)

Mode: Corrective

Structure: Potential impulse within a larger degree correction

Position: Lower degree Wave ((iv)) – Not labelled on the daily chart

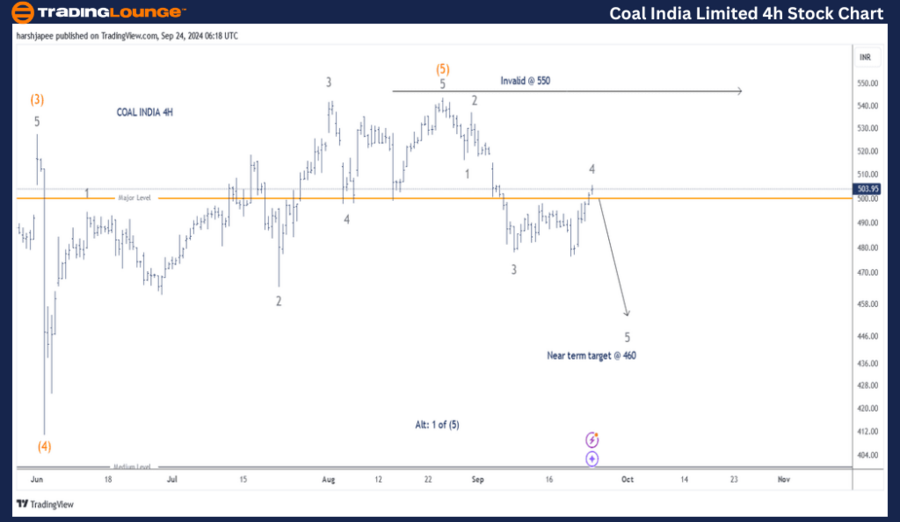
Details: As stated earlier, the alternative wave count may have become the preferred one, with a potential top forming near 550, marking the end of Intermediate Wave (5) Orange. If correct, the near-term target could be around 460. Alternatively, the high at 550 could represent Minor Wave 1 Grey of Intermediate Wave (5) Orange. In this case, the stock should stay above 413.

Invalidation Point: 550

COAL INDIA 4H Chart Technical Analysis and Potential Elliott Wave Counts:

The 4-hour chart for COAL INDIA has been revised, indicating the possible termination of Intermediate Wave (5) Orange around the 550 level. The subsequent movements have been labeled as Minor Waves 1 through 4 Grey on the chart.

If the analysis is correct, the stock could experience another near-term decline towards 460 over the next few trading sessions. Alternatively, the high at 550 may only represent Minor Wave 1 of Intermediate Wave (5), with the recent drop potentially being an expanded flat correction, concluding Minor Wave 2 Grey.

Technical Analyst: Harsh Japee

Source: visit Tradinglounge.com and learn From the Experts Join TradingLounge Here 

Previous: Bajaj Finserve Elliott Wave Technical Analysis

VALUE Offer - Buy 1 Month & Get 3 Months!Click here

Access 7 Analysts Over 200 Markets Covered. Chat Room With Support
Coal-India-Ltd-4h-St...


Conclusion:

COAL INDIA may have shifted to a bearish phase below the 550 high. Prices are now unfolding in what appears to be the first impulse down at Minor Degree, targeting 460 in the near term.

Related

South32 Limited Stock Analysis & Elliott Wave Technical Forecast: Critical Validation Points and Includes a Short-Term Forecast

South32 Limited Stock Analysis & Elliott Wave Technical Forecast: Critical Validation Points and Includes a Short-Term Forecast

This analysis provides an in-depth look at ASX: South32 Limited (S32) using Elliott Wave theory. It ...

Read More >
XRPUSD Elliott Wave Technical Analysis: XRP Price Prediction, Trading Strategy, and Technical Indicators

XRPUSD Elliott Wave Technical Analysis: XRP Price Prediction, Trading Strategy, and Technical Indicators

This article provides a comprehensive XRPUSD Elliott Wave analysis, highlighting the price predictio...

Read More >
Corn Commodity Elliottwave Technical Analysis:  Corn Price Forecast and Market Trends

Corn Commodity Elliottwave Technical Analysis: Corn Price Forecast and Market Trends

This article provides an in-depth analysis of the corn market trends expected in 2024, focusing on E...

Read More >
Commodity Market Elliott Wave Analysis: Bitcoin, Ethereum, Gold, Silver, Crude Oil, and More

Commodity Market Elliott Wave Analysis: Bitcoin, Ethereum, Gold, Silver, Crude Oil, and More

Get the latest Commodity Market Elliott Wave Analysis for Bitcoin, Ethereum, GBTC, TLT Bonds, US 10 ...

Read More >
HDFC Bank Stock Analysis: Elliott Wave, Daily and 4H Chart Insights, Key Resistance Levels, and Future Predictions

HDFC Bank Stock Analysis: Elliott Wave, Daily and 4H Chart Insights, Key Resistance Levels, and Future Predictions

This article provides a comprehensive Elliott Wave analysis of HDFC Bank's stock, featuring insi...

Read More >
Explore our detailed U.S.Dollar/Japanese Yen(USDJPY) Forex Elliott Wave Technical Analysis

Explore our detailed U.S.Dollar/Japanese Yen(USDJPY) Forex Elliott Wave Technical Analysis

Explore our detailed USD/JPY Elliott Wave analysis, focusing on daily and 4-hour charts. Understand ...

Read More >

Buy 1 Month

Get 3 Months!

Special Offer:

Trade Recommendations

Unleash the power of deversified trading with our comprehensive portfolio, covering:

  • Stock Trades
  • Crypto Trades
  • Forex Trades
  • Commodity Trades
Elliott Wave Analysis

Gain a competive edge with expert insights in to:

  • Global Indices
  • US Stocks & ASX Stocks
  • Forex & Crypto
  • Commodities
Top-Notch Trading Tools

Equip yourself with the tools of success:

  • Social Chat
  • Elliott Wave Algorithm
  • Screener
  • TradingLevels
  • Trading Game
7 Elliott Wave Analysts

Stay ahead of the market with daily charts and insightful videos
-Your secret to strategic trading!

JOIN HERE


Welcome to TradingLounge (ASIC A.R.No. 321187), specialists in trades, trading education and technical analysis, covering stocks, indices, commodities, forex and cryptocurrencies.

When you join TradingLounge you have access to everything we offer, including trade tools, educational content and a social platform to chat with like-minded investors.

Read more

@Copyright 2024 by tradinglounge.com

Contact Us

Australian no: 02 4787 6020

International no: +61 (2) 47876020

Pay with:

Find us on