KO Elliott Wave Analysis for The Coca-Cola Company (KO)

In this Elliott Wave analysis of The Coca-Cola Company (KO), we will review the latest price movements and wave structure to identify potential trading opportunities. The analysis will cover both the daily and 1-hour charts to provide a complete overview of KO's trend and momentum.

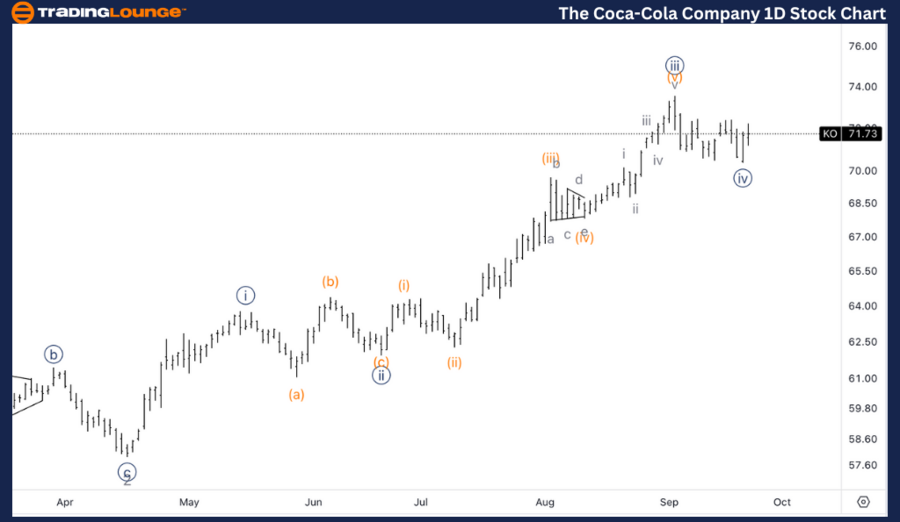
TradingLounge KO Elliott Wave Analysis: Daily Chart

The Coca-Cola Company (KO) - Daily Chart

KO Elliott Wave Technical Analysis

Function: Trend

Mode: Impulsive

Structure: Motive

Position: Wave 3

Direction: Upside in Wave 3

Details: Currently, we are observing a correction around the middle of MinorGroup2 (MG2) at $72, with the expectation of one final push into Wave {v} of 3. The target for this upward movement is $80.

The Coca-Cola Company Daily Chart Technical Analysis:

On the daily chart, Coca-Cola is advancing through an impulsive trend within Wave 3 of the overall Elliott Wave structure. The stock is consolidating around $72, which is the midpoint of MinorGroup2 (MG2), indicating a temporary correction before the next leg upward.

The main focus is on the final push into Wave {v} of 3, with a projected target of $80. This level is expected to act as a significant resistance point as Wave 3 nears completion. Traders should be mindful of possible consolidation once this target is reached, providing opportunities for strategic positioning.

The-Coca-Cola-Compan...


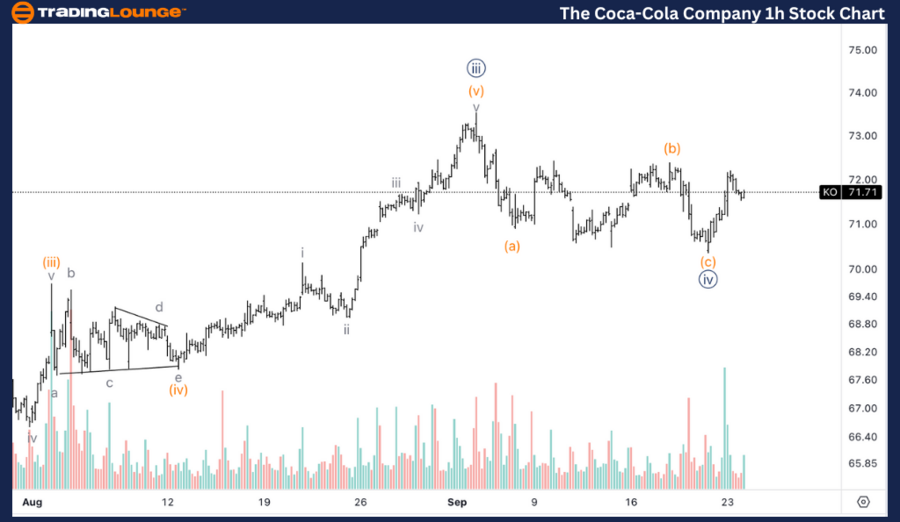
KO Elliott Wave Analysis: TradingLounge 1-Hour Chart 

The Coca-Cola Company (KO) - 1H Chart

KO Elliott Wave Technical Analysis

Function: Trend

Mode: Impulsive

Structure: Motive

Position: Wave (i) of {v}

Direction: Upside in Wave {v}

Details: The price action shows a clear three-wave corrective structure into Wave {iv}, followed by a rise with increasing volume, suggesting that a potential low is in place.

The Coca-Cola Company 1-Hour Chart Technical Analysis:

On the 1-hour chart, Coca-Cola is in the early phase of Wave (i) of {v}, with the price trending upward as the stock progresses through Wave {v}. A recent three-wave corrective structure in Wave {iv} has completed, and the increase in volume indicates that the correction has likely ended, signaling the beginning of a new impulsive wave.

This suggests that a potential low is already established, and the next upward movement within Wave {v} could push the stock toward the $80 target identified in the daily chart analysis.

Technical Analyst: Alessio Barretta

Source: visit Tradinglounge.com and learn From the Experts Join TradingLounge Here 

See Previous: Alphabet Inc Elliott Wave Technical Analysis

VALUE Offer - Buy 1 Month & Get 3 Months!Click here

Access 7 Analysts Over 200 Markets Covered. Chat Room With Support

The-Coca-Cola-Compan...

Related

Expert Forecasts, Technical Indicators, and Market Insights: Uniswap Crypto Price News Today Elliott Wave Technical Analysis

Expert Forecasts, Technical Indicators, and Market Insights: Uniswap Crypto Price News Today Elliott Wave Technical Analysis

Explore detailed Uniswap (UNIUSD) Elliott Wave analysis with insights into price predictions and mar...

Read More >
Anticipate future price actions: New Zealand Dollar/U.S.Dollar (NZDUSD) Elliott Wave Technical Analysis

Anticipate future price actions: New Zealand Dollar/U.S.Dollar (NZDUSD) Elliott Wave Technical Analysis

Gain valuable insights into NZDUSD's price movements with our comprehensive Elliott Wave analysi...

Read More >
RUSSELL 2000 Elliott Wave Technical Analysis: Identifying Key Market Trends and Forecasting Future Movements

RUSSELL 2000 Elliott Wave Technical Analysis: Identifying Key Market Trends and Forecasting Future Movements

The Russell 2000 Elliott Wave analysis with daily and weekly charts, A comprehensive look at the mar...

Read More >
Our Detailed Elliott Wave Technical Analysis of ASX: SCG Offers Insights into Scentre Group's Stock Movements

Our Detailed Elliott Wave Technical Analysis of ASX: SCG Offers Insights into Scentre Group's Stock Movements

Our detailed Elliott Wave analysis of ASX: SCG offers insights into Scentre Group's stock moveme...

Read More >
Understanding Alphabet Inc. (GOOGL) Through Elliott Wave Analysis: An In-depth Daily and 4-Hour Chart Review

Understanding Alphabet Inc. (GOOGL) Through Elliott Wave Analysis: An In-depth Daily and 4-Hour Chart Review

Dive into an in-depth analysis of Alphabet Inc. (GOOGL) with our latest stock forecast and Elliott W...

Read More >
BAJAJ AUTO Stocks Elliott Wave Technical Analysis: Focusing on Current Price Targets, Wave Counts, and Potential Trends.

BAJAJ AUTO Stocks Elliott Wave Technical Analysis: Focusing on Current Price Targets, Wave Counts, and Potential Trends.

This article provides an in-depth Elliott Wave analysis of Bajaj Auto, focusing on current price tar...

Read More >

Buy 1 Month

Get 3 Months!

Special Offer:

Trade Recommendations

Unleash the power of deversified trading with our comprehensive portfolio, covering:

  • Stock Trades
  • Crypto Trades
  • Forex Trades
  • Commodity Trades
Elliott Wave Analysis

Gain a competive edge with expert insights in to:

  • Global Indices
  • US Stocks & ASX Stocks
  • Forex & Crypto
  • Commodities
Top-Notch Trading Tools

Equip yourself with the tools of success:

  • Social Chat
  • Elliott Wave Algorithm
  • Screener
  • TradingLevels
  • Trading Game
7 Elliott Wave Analysts

Stay ahead of the market with daily charts and insightful videos
-Your secret to strategic trading!

JOIN HERE


Welcome to TradingLounge (ASIC A.R.No. 321187), specialists in trades, trading education and technical analysis, covering stocks, indices, commodities, forex and cryptocurrencies.

When you join TradingLounge you have access to everything we offer, including trade tools, educational content and a social platform to chat with like-minded investors.

Read more

@Copyright 2024 by tradinglounge.com

Contact Us

Australian no: 02 4787 6020

International no: +61 (2) 47876020

Pay with:

Find us on