TradingLounge TATA Consumer Product Stock Analysis – Day Chart

TATA Consumer Product Stock Chart Analysis

TATACONSUM Elliott Wave Technical Analysis

Function: Larger Degree Trend Higher (Intermediate degree, orange)

Mode: Motive

Structure: Impulse

Position: Minute Wave (iv) Navy

Details: Minute Wave (v) Navy is moving higher within Minor Wave 5 Grey of Intermediate Wave (5) Orange, holding above 1145.

Invalidation Point: 1145, Risk tightened

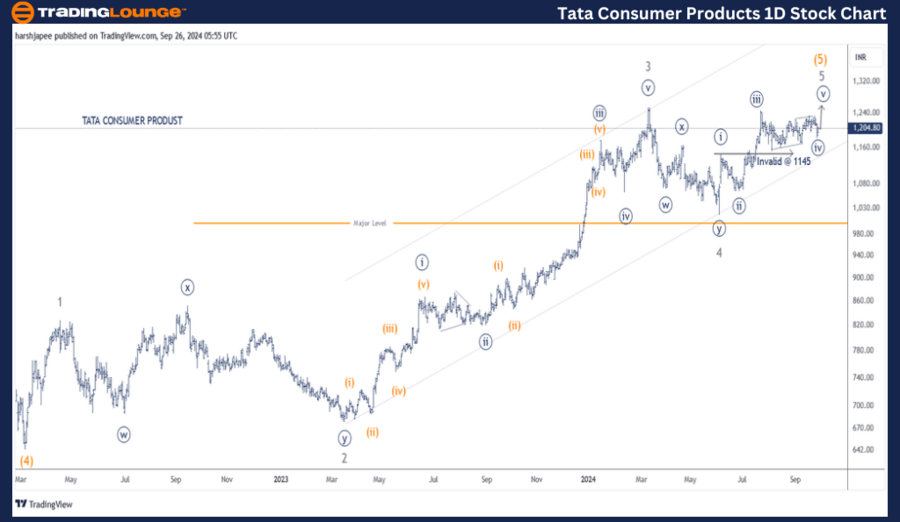
TATA Consumer Product Daily Chart Technical Analysis and Potential Elliott Wave Counts:

The daily chart of TATA Consumer Product indicates an ongoing uptrend, with the stock in the final phase of its fifth wave at various degrees, aiming for the 1300 level. It is currently progressing within Minute Wave ((v)) Navy of Minor Wave 5 Grey, holding against the 1145 level.

In March 2022, TATA Consumer Product's stock concluded Intermediate Wave (4) Orange around the 645 mark. Since then, the stock has rallied past 1260, completing Minor Wave 3 Grey. Minor Wave 4 concluded around 1020 on June 04, 2024.

Minor Wave 5 has been developing since then, with the potential completion of Minute Waves ((i)) through ((iv)) as depicted on the chart. If correct, the stock is now unfolding Minute Wave ((v)), likely targeting above the 1300 level.

Tata-Consumer-Produc...


TradingLounge TATA Consumer Product Stock Analysis – 4H Chart

TATA CONSUMER PRODUCT – TATACONSUM Technical Analysis

Function: Larger Degree Trend Higher (Intermediate degree, orange)

Mode: Motive

Structure: Impulse

Position: Minute Wave (iv) Navy

Details: Minute Wave (v) Navy is advancing within Minor Wave 5 Grey of Intermediate Wave (5) Orange, with potential upside toward the 1325 mark, while maintaining a key support at 1145.

Invalidation Point: 1145, Risk tightened

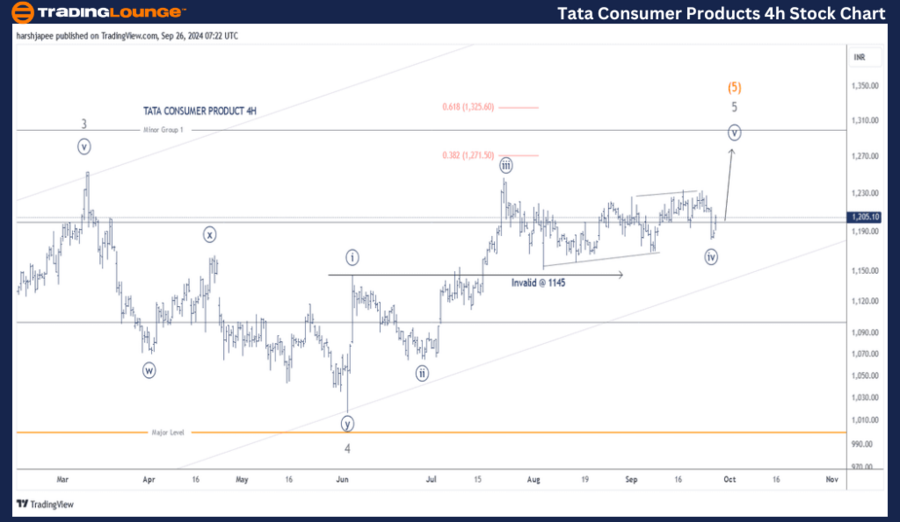
TATA Consumer Product 4H Chart Technical Analysis and Potential Elliott Wave Counts:

The 4H chart for TATA Consumer Product outlines the sub-waves following the completion of Minor Wave 3 Grey near the 1260 level. Minor Wave 4 developed as a combination wave ((w))-((x))-((y)), finishing around 1020. Minor Wave 5 is likely unfolding as an impulse wave, with the potential to push towards the 1325 level. The stock should ideally remain above the 1145 support level.

Technical Analyst: Harsh Japee

Source: visit Tradinglounge.com and learn From the Experts Join TradingLounge Here 

Previous: MAHINDRA & MAHINDRA Elliott Wave Technical Analysis

VALUE Offer - Buy 1 Month & Get 3 Months!Click here

Access 7 Analysts Over 200 Markets Covered. Chat Room With Support

Tata-Consumer-Produc...


Conclusion:

TATA Consumer Product is advancing within Minute Wave ((v)) of Minor Wave 5, part of Intermediate Wave (5), while holding above the 1145 support level.

Related

S&P/TSX 60 Index Elliott Wave Technical Analysis Shows Reinforcing the overall Bullish Outlook in both Daily and Weekly Charts

S&P/TSX 60 Index Elliott Wave Technical Analysis Shows Reinforcing the overall Bullish Outlook in both Daily and Weekly Charts

The S&P/TSX 60 is in a bullish trend, according to Elliott Wave analysis. Gray wave 2 of orange wave...

Read More >
WTI Crudeoil Commodity Elliott Wave Technical Analysis: Highlights Significant Support and Resistance levels to watch

WTI Crudeoil Commodity Elliott Wave Technical Analysis: Highlights Significant Support and Resistance levels to watch

This article provides an in-depth Elliott Wave analysis of WTI crude oil, focusing on its bearish cy...

Read More >
The Walt Disney Company(DIS:NYSE) Elliott Wave Technical Analysis 17 January 24

The Walt Disney Company(DIS:NYSE) Elliott Wave Technical Analysis 17 January 24

The Walt Disney Company Elliott Wave Technical Analysis dated 17 January 24, DIS Stock Market Analys...

Read More >
Master the Euro/U.S. Dollar Forex Market: Advanced EURUSD Elliott Wave Technical Analysis for Precision Trading on Day and 4-Hour Charts

Master the Euro/U.S. Dollar Forex Market: Advanced EURUSD Elliott Wave Technical Analysis for Precision Trading on Day and 4-Hour Charts

Gain a thorough understanding of the EURUSD market with our detailed Elliott Wave analysis. This art...

Read More >
Elliott Wave Analysis: VeChain (VETUSD) Technical Outlook - February 2, 2024

Elliott Wave Analysis: VeChain (VETUSD) Technical Outlook - February 2, 2024

Elliott Wave Analysis reveals potential trading opportunities for VeChain (VETUSD) on February 2, 20...

Read More >
Effective trading strategies and technical analysis: British Pound/U.S.Dollar(GBPUSD) Forex Elliott Wave Technical Analysis

Effective trading strategies and technical analysis: British Pound/U.S.Dollar(GBPUSD) Forex Elliott Wave Technical Analysis

This detailed analysis of GBP/USD using Elliott Wave Theory provides key insights into the current m...

Read More >

Buy 1 Month

Get 3 Months!

Special Offer:

Trade Recommendations

Unleash the power of deversified trading with our comprehensive portfolio, covering:

  • Stock Trades
  • Crypto Trades
  • Forex Trades
  • Commodity Trades
Elliott Wave Analysis

Gain a competive edge with expert insights in to:

  • Global Indices
  • US Stocks & ASX Stocks
  • Forex & Crypto
  • Commodities
Top-Notch Trading Tools

Equip yourself with the tools of success:

  • Social Chat
  • Elliott Wave Algorithm
  • Screener
  • TradingLevels
  • Trading Game
7 Elliott Wave Analysts

Stay ahead of the market with daily charts and insightful videos
-Your secret to strategic trading!

JOIN HERE


Welcome to TradingLounge (ASIC A.R.No. 321187), specialists in trades, trading education and technical analysis, covering stocks, indices, commodities, forex and cryptocurrencies.

When you join TradingLounge you have access to everything we offer, including trade tools, educational content and a social platform to chat with like-minded investors.

Read more

@Copyright 2024 by tradinglounge.com

Contact Us

Australian no: 02 4787 6020

International no: +61 (2) 47876020

Pay with:

Find us on