Gold XAUUSD Elliott Wave Technical Analysis

Gold has seen a pullback in the last days of September after hitting another all-time high. The ongoing impulse wave cycle, which started in October 2022, indicates that once the current correction finds support, further rallies could follow.

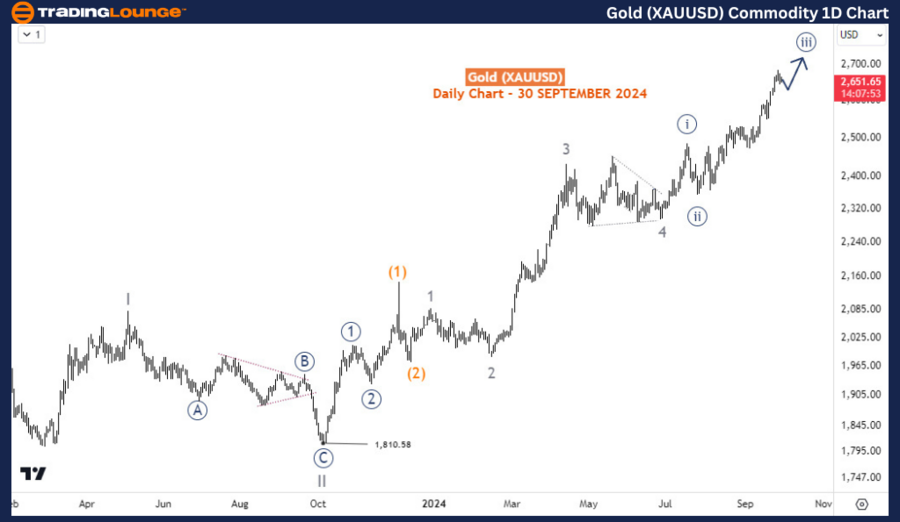
Gold XAUUSD Commodity Daily Chart Analysis

From an Elliott Wave standpoint, the daily chart reveals that Gold began a cycle degree impulse wave sequence in October 2022. Waves I and II of this sequence completed in May 2023 and October 2023, respectively. Gold is now in the third wave, with wave III still incomplete. Specifically, Gold is in wave 5 of (3) of 3 (circled) of III, suggesting that significant upside potential remains. This analysis points to Gold's bullish trend continuing, with potential pullbacks offering traders buying opportunities as the upward trend likely resumes.

Gold-XAUUSD-Commodit...


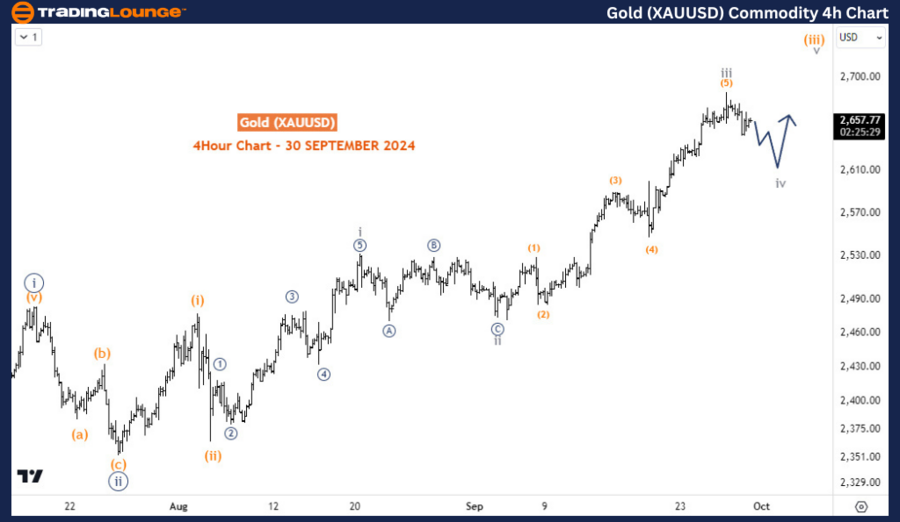
Gold XAUUSD Commodity H4 Chart Analysis

On the H4 chart, Gold is experiencing a pullback, likely forming sub-minuette degree wave iv of minuette degree wave (iii) of minute degree wave iii (circled). After wave iv finds support, bullish momentum is expected to return, continuing the rally. Buyers could look for entry points near the dip, anticipating the upward trend to resume once wave iv is completed.

Technical Analyst: Sanmi Adeagbo

Source: visit Tradinglounge.com and learn From the Experts Join TradingLounge Here 

See Previous: Cocoa Elliott Wave Technical Analysis

VALUE Offer - Buy 1 Month & Get 3 Months!Click here

Access 7 Analysts Over 200 Markets Covered. Chat Room With Support

Gold-XAUUSD-Commodit...


Conclusion

In summary, Gold remains in a long-term bullish trend, with more rallies expected after the current pullback ends. Elliott Wave analysis suggests that wave III is still developing, leaving room for more upside potential. Traders should monitor key support levels, as these pullbacks could offer attractive buying opportunities before Gold resumes its upward movement.

Related

U.S.Dollar/Japanese Yen (USDJPY) 4 Hour and Day Chart Elliott Wave Technical Analysis 17 October 23

U.S.Dollar/Japanese Yen (USDJPY) 4 Hour and Day Chart Elliott Wave Technical Analysis 17 October 23

In summary, the USD/JPY Elliott Wave Analysis for 17 October 23, provides valuable insights for trad...

Read More >
Understand Forex Market Trends, Wave Structures, and Forecasted Movements: AUDJPY Forex Elliott Wave Technical Analysis

Understand Forex Market Trends, Wave Structures, and Forecasted Movements: AUDJPY Forex Elliott Wave Technical Analysis

Our detailed AUDJPY Elliott Wave Analysis covers both daily and 4-hour charts, providing a comprehen...

Read More >
Elliott Wave Technical Analysis of the Dow Jones Industrial Average (DJI), Offering Valuable Insights for Investors and Traders

Elliott Wave Technical Analysis of the Dow Jones Industrial Average (DJI), Offering Valuable Insights for Investors and Traders

This comprehensive guide provides a thorough Elliott Wave Analysis of the Dow Jones Industrial Avera...

Read More >
S&P/TSX 60 Index Elliott Wave Technical Analysis: Ideal for Investors Seeking Expert Tips, Trading Strategies, and Market Movements

S&P/TSX 60 Index Elliott Wave Technical Analysis: Ideal for Investors Seeking Expert Tips, Trading Strategies, and Market Movements

Our comprehensive S&P/TSX Composite trading analysis provides actionable insights using Elliott Wave...

Read More >
Visa Inc. (V) Stocks Elliott Wave Technical Analysis: Key Price Levels and Stock Forecast for Bullish Momentum

Visa Inc. (V) Stocks Elliott Wave Technical Analysis: Key Price Levels and Stock Forecast for Bullish Momentum

This analysis provides a detailed Elliott Wave interpretation for Visa Inc. (V), covering both the d...

Read More >
Wheat Elliott Wave Technical Analysis: Navigating the Bearish Trend Towards a Potential Reversal

Wheat Elliott Wave Technical Analysis: Navigating the Bearish Trend Towards a Potential Reversal

In our analysis of Wheat's Elliott Wave patterns, we observe a persistent bearish trend since 20...

Read More >

Buy 1 Month

Get 3 Months!

Special Offer:

Trade Recommendations

Unleash the power of deversified trading with our comprehensive portfolio, covering:

  • Stock Trades
  • Crypto Trades
  • Forex Trades
  • Commodity Trades
Elliott Wave Analysis

Gain a competive edge with expert insights in to:

  • Global Indices
  • US Stocks & ASX Stocks
  • Forex & Crypto
  • Commodities
Top-Notch Trading Tools

Equip yourself with the tools of success:

  • Social Chat
  • Elliott Wave Algorithm
  • Screener
  • TradingLevels
  • Trading Game
7 Elliott Wave Analysts

Stay ahead of the market with daily charts and insightful videos
-Your secret to strategic trading!

JOIN HERE


Welcome to TradingLounge (ASIC A.R.No. 321187), specialists in trades, trading education and technical analysis, covering stocks, indices, commodities, forex and cryptocurrencies.

When you join TradingLounge you have access to everything we offer, including trade tools, educational content and a social platform to chat with like-minded investors.

Read more

@Copyright 2024 by tradinglounge.com

Contact Us

Australian no: 02 4787 6020

International no: +61 (2) 47876020

Pay with:

Find us on