Britannia Industries – BRITANNIA (1D Chart) Elliott Wave Analysis

BRITANNIA  Elliott Wave Technical Analysis

Function: Larger Degree Trend Higher (Intermediate degree, orange.)

Mode: Motive

Structure: Impulse/Diagonal

Position: Minute Wave ((iv))

Details: Minute Wave ((iv)) Navy might be unfolding within Minor Wave 3 of Intermediate Wave (5) against 5950.

Invalidation point: 5730

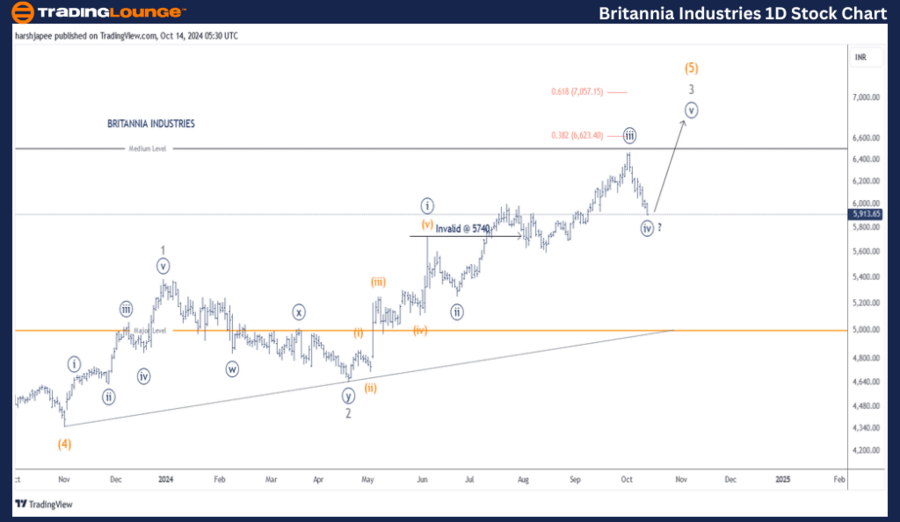
Britannia Industries Daily Chart Technical Analysis and potential Elliott Wave Counts

Britannia Industries daily chart is indicating a progressive rally, which could be unfolding Minor Wave 3 Grey, within Intermediate Wave (5) Orange towards 7050 at least and up to 8000 levels going forward. The stock should ideally stay above 5730-40 range to keep the bullish structure intact.

Britannia Industries has been rallying since November 2023 after printing lows around 4300-50 range, terminating Intermediate Wave (4) Orange. Furthermore, Minor Waves 1 and 2 Grey seems to have terminated around 5170 and 4650 levels respectively.

Minor Wave 3 Grey has been unfolding against 4650 mark and is sub dividing within a potential impulse. Minute Waves ((i)) through ((iv)) might be complete and Minute Wave ((v)) might be underway higher soon. The stock should hold above 5740 mark for impulse to complete.

Britannia-Industries...


Britannia Industries – BRITANNIA Elliott Wave Analysis (4H Chart)

Function: Larger Degree Trend Higher (Intermediate degree, orange.)

Mode: Motive

Structure: Impulse/Diagonal

Position: Minute Wave ((iv))

Details: Minute Wave ((iv)) Navy might be unfolding or near to complete within Minor Wave 3 of Intermediate Wave (5) against 5730. If correct, Minute Wave ((v)) could resume higher towards 7060.

Invalidation point: 5730

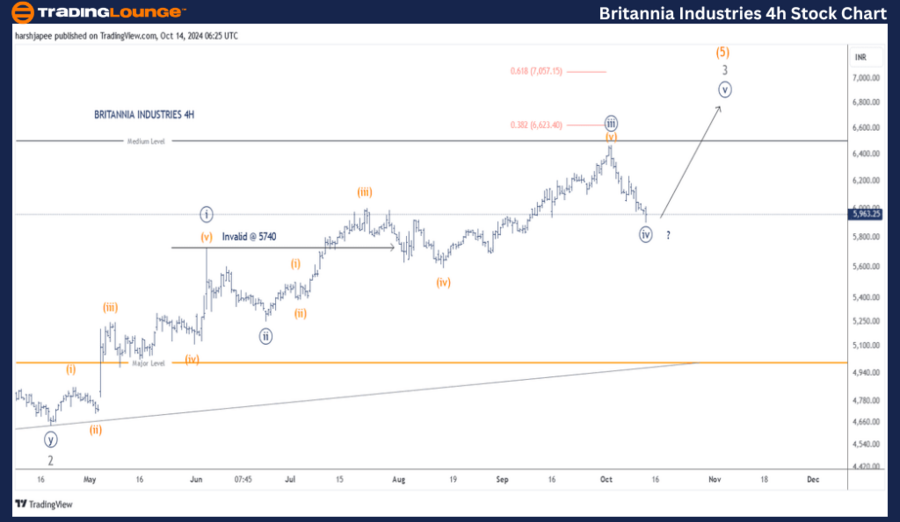
Britannia Industries 4H Chart Technical Analysis and potential Elliott Wave Counts:

Britannia Industries 4H chart is indicative of potential Minute Wave ((v)) Navy complete around 5910 mark at the time of writing. If correct, the stock should progress higher from here, as Minute Wave (v) of Minor Wave 3 resumes.

Technical Analyst: Harsh Japee

Source: visit Tradinglounge.com and learn From the Experts Join TradingLounge Here 

Previous: Tech Mahindra – TECHM Elliott Wave Technical Analysis

VALUE Offer - Buy 1 Month & Get 3 Months!Click here

Access 7 Analysts Over 200 Markets Covered. Chat Room With Support

Britannia-Industries...


Conclusion:

Britannia Industries appears positioned to push higher from the 5910 low recorded on October 14, 2024. The next phase—Minute Wave ((v)) of Minor Wave 3 Grey—seems ready to unfold, further supporting the bullish trend toward higher levels.

Related

Our Detailed Technical Insights of ASX Brambles Limited- BXB Stock Analysis & Elliott Wave Technical Forecast

Our Detailed Technical Insights of ASX Brambles Limited- BXB Stock Analysis & Elliott Wave Technical Forecast

Explore the latest Elliott Wave analysis for BRAMBLES LIMITED (BXB) on the ASX. Our detailed technic...

Read More >
Fortinet Inc.(FTNT:NASDAQ) Elliott Wave Technical Analysis 12 October 23

Fortinet Inc.(FTNT:NASDAQ) Elliott Wave Technical Analysis 12 October 23

Fortinet Inc.,(FTNT: NASDAQ) Elliott Wave Technical Analysis 4-hour Chart and 1-hour Chart.

Read More >
U.S.Dollar/Japanese Yen (USDJPY) Elliott Wave Technical Analysis 29 January 24

U.S.Dollar/Japanese Yen (USDJPY) Elliott Wave Technical Analysis 29 January 24

The USDJPY Elliott Wave Analysis dated 29 January 24, provides a comprehensive examination of the U....

Read More >
Learn how to utilize important indicators: XRP Crypto Price News Today XRP/USD Elliott Wave Technical Analysis

Learn how to utilize important indicators: XRP Crypto Price News Today XRP/USD Elliott Wave Technical Analysis

Get an in-depth analysis of XRP/USD with our latest Elliott Wave technical analysis. Understand the ...

Read More >
Unlocking ASX Trading Success: TELSTRA GROUP LIMITED - TLS Stock Analysis & Elliott Wave Technical Forecast

Unlocking ASX Trading Success: TELSTRA GROUP LIMITED - TLS Stock Analysis & Elliott Wave Technical Forecast

Dive into the latest Telstra Group Limited (TLS.ASX) analysis with Elliott Wave insights. Learn abou...

Read More >
Cardano Crypto Price News Today Elliott Wave Technical Analysis of ADA/USD: TradingLounge Daily and H4 Chart Overview

Cardano Crypto Price News Today Elliott Wave Technical Analysis of ADA/USD: TradingLounge Daily and H4 Chart Overview

This article provides a comprehensive Elliott Wave analysis for Cardano/USD (ADAUSD), offering insig...

Read More >

Buy 1 Month

Get 3 Months!

Special Offer:

Trade Recommendations

Unleash the power of deversified trading with our comprehensive portfolio, covering:

  • Stock Trades
  • Crypto Trades
  • Forex Trades
  • Commodity Trades
Elliott Wave Analysis

Gain a competive edge with expert insights in to:

  • Global Indices
  • US Stocks & ASX Stocks
  • Forex & Crypto
  • Commodities
Top-Notch Trading Tools

Equip yourself with the tools of success:

  • Social Chat
  • Elliott Wave Algorithm
  • Screener
  • TradingLevels
  • Trading Game
7 Elliott Wave Analysts

Stay ahead of the market with daily charts and insightful videos
-Your secret to strategic trading!

JOIN HERE


Welcome to TradingLounge (ASIC A.R.No. 321187), specialists in trades, trading education and technical analysis, covering stocks, indices, commodities, forex and cryptocurrencies.

When you join TradingLounge you have access to everything we offer, including trade tools, educational content and a social platform to chat with like-minded investors.

Read more

@Copyright 2024 by tradinglounge.com

Contact Us

Australian no: 02 4787 6020

International no: +61 (2) 47876020

Pay with:

Find us on