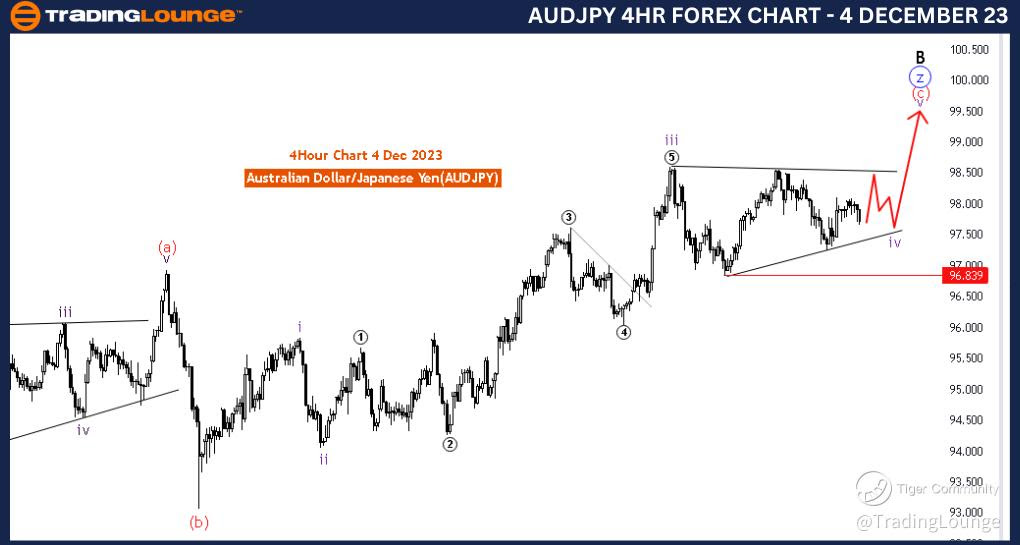
AUDJPY Elliott Wave Analysis Trading Lounge 4 Hour Chart,4 December 23
Australian Dollar / Japanese Yen(AUDJPY) 4 Hour Chart
AUDJPY Elliott Wave Technical Analysis
Function: Counter Trend
Mode: Corrective
Structure: purple wave 4 of C
Position: Zof B
Direction Next Higher Degrees: purple wave 5 of C
Details: purple wave 4 is in play as sideways (triangle) ,Wave Cancel invalid level: 98.839
The "AUDJPY Elliott Wave Analysis Trading Lounge 4 Hour Chart" dated 4 December 23, provides a comprehensive examination of the Australian Dollar/Japanese Yen (AUDJPY) currency pair within a four-hour timeframe, utilizing Elliott Wave principles for technical analysis.
The primary "Function" identified in the analysis is "Counter Trend," indicating a focus on understanding and navigating potential corrective movements in the market. This implies an awareness of the probability of a temporary deviation from the prevailing trend.
The specified "Mode" is "Corrective," suggesting that the market is currently displaying characteristics of a corrective wave. Corrective waves often involve price retracements or sideways movements, providing an opportunity for traders to anticipate potential trend resumptions.
The main "Structure" under scrutiny is "purple wave 4 of C," indicating a corrective sub-wave within the larger C wave of the Elliott Wave structure. This implies a detailed analysis of the ongoing correction and its potential implications for the broader trend.
The designated "Position" is "Z of B," signifying the specific wave position within the larger degree of the correction. This suggests an in-depth analysis of the sub-wave within the broader corrective structure.
The directional guidance for "Next Higher Degrees" is "purple wave 5 of C," implying an anticipation of the resumption of the larger corrective wave after the completion of the current wave (purple wave 4).
Regarding "Details," the analysis notes that "purple wave 4 is in play as sideways (triangle)." This provides traders with insight into the nature of the correction, indicating a potential triangular pattern, which is a specific type of corrective structure.
The "Wave Cancel invalid level" is set at 98.839, serving as a crucial reference point for potential invalidation of the current wave count. This level acts as a guide for traders, helping them identify potential points of trend confirmation or reversal.
In conclusion, the AUDJPY Elliott Wave Analysis on the 4-hour chart suggests that the market is currently undergoing a corrective phase (purple wave 4 of C), characterized by a sideways movement, potentially forming a triangle. Traders are provided with insights into specific wave positions and a key reference level for potential trend reversals or confirmations in the broader corrective structure.
Technical Analyst: Malik Awais
Source: Tradinglounge.com get trial here!
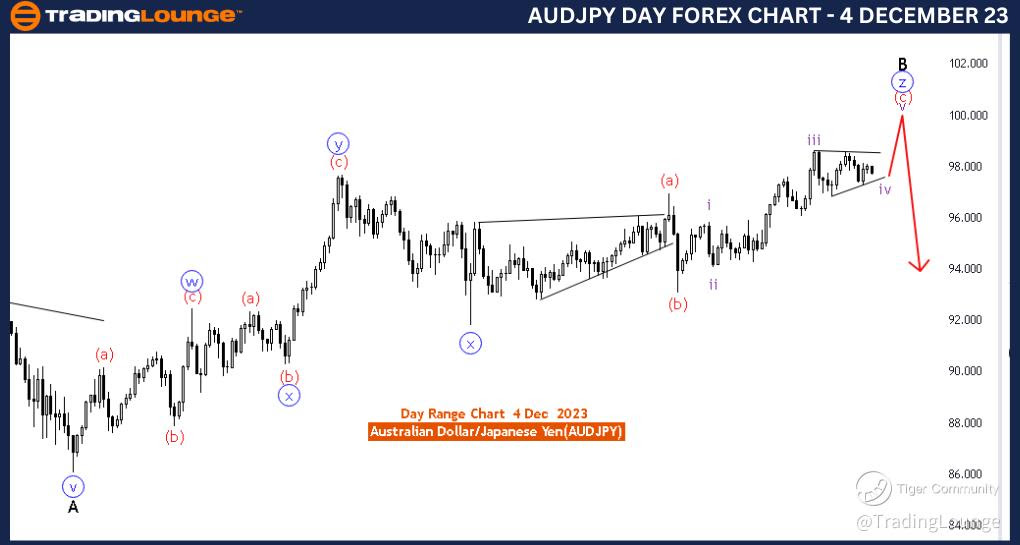
AUDJPY Elliott Wave Analysis Trading Lounge Day Chart,4 December 23
Australian Dollar / Japanese Yen(AUDJPY) Day Chart
AUDJPY Elliott Wave Technical Analysis
Function: Counter Trend
Mode: Corrective
Structure: C of Z
Position: Black wave B
Direction Next Lower Degrees: Black wave C
Details: wace C of Z is in play ,after that black wave C expected
The "AUDJPY Elliott Wave Analysis Trading Lounge Day Chart" for 4 December 23, focuses on the Australian Dollar/Japanese Yen (AUDJPY) currency pair within a daily timeframe, employing Elliott Wave principles for technical analysis.
The primary identified "Function" is "Counter Trend," indicating an emphasis on understanding and navigating potential corrective movements in the market. This suggests an acknowledgment of a temporary deviation from the prevailing trend, providing insights for traders looking to capitalize on corrective waves.
The specified "Mode" is "Corrective," suggesting that the market is currently exhibiting characteristics of a corrective wave. Corrective waves often involve price retracements or sideways movements, presenting opportunities for traders to anticipate potential trend resumptions.
The primary "Structure" under analysis is "C of Z," implying a corrective sub-wave within the larger Z wave of the Elliott Wave structure. This signals a detailed examination of the ongoing correction and its potential implications for the broader trend.
The designated "Position" is "Black wave B," indicating the specific wave position within the larger degree of the correction. This suggests a granular analysis of the sub-wave within the broader corrective structure.
The directional guidance for "Next Lower Degrees" is "Black wave C," suggesting an anticipation of the next downward wave within the larger corrective structure after the completion of the current wave (C of Z).
Regarding "Details," the analysis notes that "wave C of Z is in play," indicating that the current correction is unfolding as a C wave within the larger Z wave. This provides traders with insights into the specific structure of the ongoing correction.
In conclusion, the AUDJPY Elliott Wave Analysis on the daily chart for 4 December 23, suggests that the market is currently undergoing a corrective phase (C of Z), with a focus on the specific wave position (Black wave B) within this larger corrective structure. Traders are provided with directional guidance for the expected next wave (Black wave C) and key insights into the structure of the ongoing correction.
Technical Analyst: Malik Awais
Source: Tradinglounge.com get trial here!