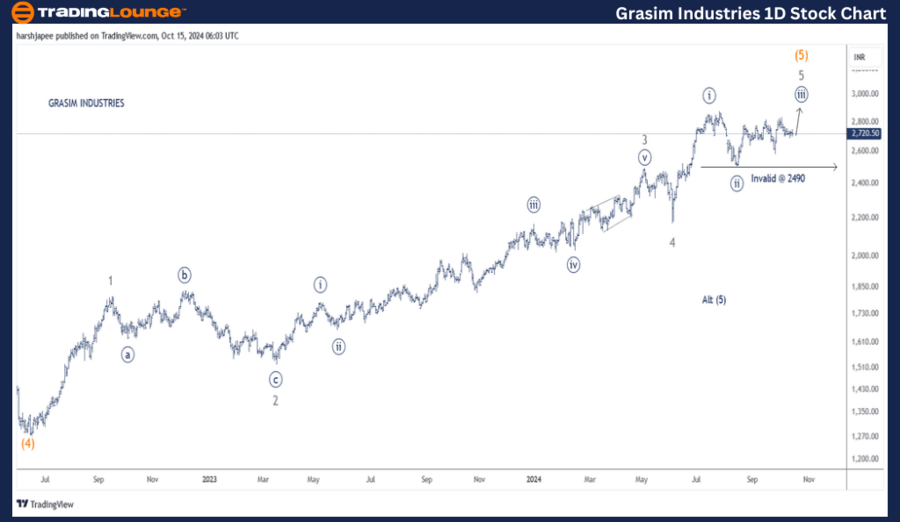
GRASIM INDUSTRIES – GRASIM (1D Chart) Elliott Wave Technical Analysis

GRASIM  Elliott Wave Technical Analysis

Function: Larger Degree Trend: Higher (Intermediate Degree, Orange – Wave (5))

Mode: Motive

Structure: Impulse

Position: Minute Wave ((iii)) Navy

Details:

  • Minute Wave ((iii)) Navy of Minor Wave 5 Grey is moving higher within Intermediate Wave (5) Orange, maintaining support at 2490.
  • Alternatively, Intermediate Wave (5) Orange could already be complete above 2900.
  • Invalidation Point: 2490

Grasim Industries Daily Chart: Elliott Wave Analysis & Key Levels

  • The daily chart suggests an active rally, with Minute Wave ((iii)) Navy unfolding within Minor Wave 5 Grey, all moving upward within Intermediate Wave (5) Orange. Key support lies at 2490.
  • Alternatively, if Wave (5) Orange has already completed, it may have peaked around the 2900 level.

Grasim Industries has followed a strong uptrend since reaching a low around 1270 in June 2022, marking the termination of Intermediate Wave (4).
The structure appears to be forming five waves, unfolding as Minor Waves 1 through 5 Grey (with Wave 5 still progressing).

  • If the bullish structure holds, the stock may target a push above 3000, signaling the completion of Intermediate Wave (5) Orange.
  • A sustained move above 2450, where Minute Wave ((ii)) ended, will confirm that the bullish trend remains intact.

GRASIM-INDUSTRIES-1D...


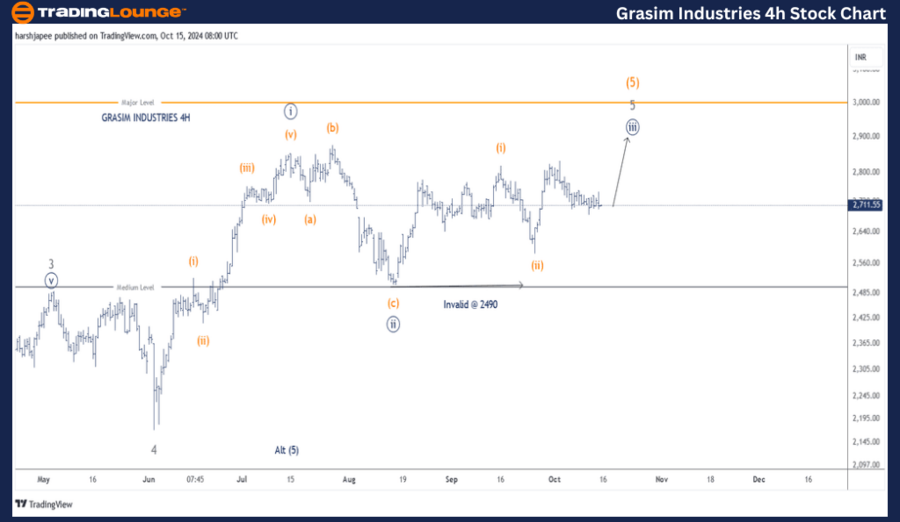
GRASIM INDUSTRIES – GRASIM (4H Chart) Elliott Wave Technical Analysis

Function: Larger Degree Trend: Higher (Intermediate Degree, Orange – Wave (5))

Mode: Motive

Structure: Impulse

Position: Minute Wave ((iii)) Navy

Details:

  • Minute Wave ((iii)) Navy of Minor Wave 5 Grey is progressing higher within Intermediate Wave (5) Orange, with Minuette Wave (ii) Orange appearing complete near 2700.
  • If this count holds, Minuette Wave (iii) should be in progress.
  • Alternatively, Intermediate Wave (5) Orange may already have concluded above 2900.
  • Invalidation Point: 2490

Grasim Industries 4H Chart: Elliott Wave Insights

The 4H chart highlights the formation of Minuette Waves within the Minute Waves ((i)) and ((ii)) Navy.

  • Minute Wave ((i)) completed as an impulse, followed by a corrective 3-3-5 expanded flat pattern for Minute Wave ((ii)), ending around 2490.
  • Minute Wave ((iii)) is now advancing higher, maintaining support at 2490.

GRASIM-INDUSTRIES-4H...

Technical Analyst: Harsh Japee

Source: visit Tradinglounge.com and learn From the Experts Join TradingLounge Here 

Previous: BRITANNIA  Elliott Wave Technical Analysis 

VALUE Offer - Buy 1 Month & Get 3 Months!Click here

Access 7 Analysts Over 200 Markets Covered. Chat Room With Support

Conclusion:

Grasim Industries continues to move higher within Minute Wave ((iii)) Navy of Minor Wave 5 Grey, part of Intermediate Wave (5) Orange, with key support at 2490.

Related

Copper Elliott Wave Technical Analysis: Price Forecast, Key Levels, and Commodity Market Trends

Copper Elliott Wave Technical Analysis: Price Forecast, Key Levels, and Commodity Market Trends

This article provides a detailed Elliott Wave analysis of copper, highlighting key market trends, pr...

Read More >
Bullish Momentum Continues: BTCUSD Elliott Wave Technical Analysis with potential trading opportunities

Bullish Momentum Continues: BTCUSD Elliott Wave Technical Analysis with potential trading opportunities

The BTCUSD Elliott Wave analysis for February 19, 24 indicates a bullish trend with potential tradin...

Read More >
 AUDUSD Elliott Wave Technical Forecast: Bearish Trend Insights and Key Price Levels

AUDUSD Elliott Wave Technical Forecast: Bearish Trend Insights and Key Price Levels

This in-depth AUDUSD Elliott Wave analysis reveals a bearish trend in the impulsive wave structure, ...

Read More >
Polkadot Crypto Price News Today DOTUSD Elliott Wave Technical Analysis: Stay informed with the latest Polkadot insights

Polkadot Crypto Price News Today DOTUSD Elliott Wave Technical Analysis: Stay informed with the latest Polkadot insights

Discover comprehensive Polkadot price analysis using Elliott Wave theory. Our experts provide in-dep...

Read More >
Cocoa Commodity Elliott Wave Technical Analysis: Navigating Current Trends and Future Possibilities

Cocoa Commodity Elliott Wave Technical Analysis: Navigating Current Trends and Future Possibilities

Discover the latest insights into the cocoa market with our in-depth Elliott Wave analysis. Learn ab...

Read More >
Our Elliott Wave Analysis Provides Insight into Upcoming Price Movements for ASX: Insurance Australia Group Limited (IAG)

Our Elliott Wave Analysis Provides Insight into Upcoming Price Movements for ASX: Insurance Australia Group Limited (IAG)

Looking for an in-depth IAG stock forecast? Our Elliott Wave analysis provides insight into upcoming...

Read More >

Buy 1 Month

Get 3 Months!

Special Offer:

Trade Recommendations

Unleash the power of deversified trading with our comprehensive portfolio, covering:

  • Stock Trades
  • Crypto Trades
  • Forex Trades
  • Commodity Trades
Elliott Wave Analysis

Gain a competive edge with expert insights in to:

  • Global Indices
  • US Stocks & ASX Stocks
  • Forex & Crypto
  • Commodities
Top-Notch Trading Tools

Equip yourself with the tools of success:

  • Social Chat
  • Elliott Wave Algorithm
  • Screener
  • TradingLevels
  • Trading Game
7 Elliott Wave Analysts

Stay ahead of the market with daily charts and insightful videos
-Your secret to strategic trading!

JOIN HERE


Welcome to TradingLounge (ASIC A.R.No. 321187), specialists in trades, trading education and technical analysis, covering stocks, indices, commodities, forex and cryptocurrencies.

When you join TradingLounge you have access to everything we offer, including trade tools, educational content and a social platform to chat with like-minded investors.

Read more

@Copyright 2024 by tradinglounge.com

Contact Us

Australian no: 02 4787 6020

International no: +61 (2) 47876020

Pay with:

Find us on