ASX: CSL LIMITED - Elliott Wave Analysis TradingLounge (1D Chart)

Greetings, in today's Elliott Wave analysis, we update our outlook for CSL LIMITED (ASX: CSL). We observe bullish momentum developing in wave iii-grey, but we need to wait for the completion of wave ii-grey before making any definitive moves.

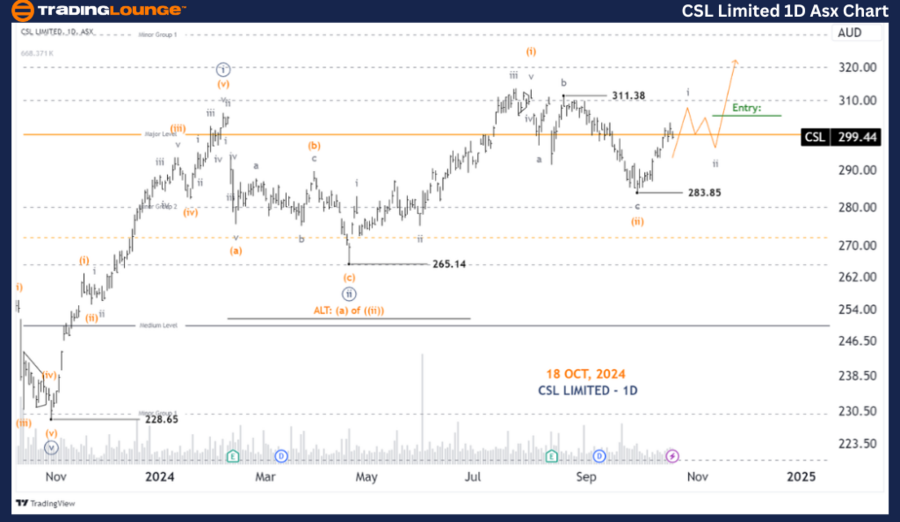
ASX: CSL LIMITED - 1D Chart (Semilog Scale) Analysis

CSL LIMITED Elliott Wave Technical Analysis

Function: Major Trend (Minute Degree, Navy)

Mode: Motive

Structure: Impulse

Position: Wave i-grey of Wave (iii)-orange of Wave ((iii))-navy

Details: The daily chart offers a clearer perspective compared to the weekly chart. It suggests that wave (ii)-orange may have ended, and wave (iii)-orange is poised to begin moving upward. A Long Trade Setup will be considered once the price tests the Major Level 100.00 as support.

Invalidation Point: 283.35

CSL-LIMITED-1D-Asx-C...


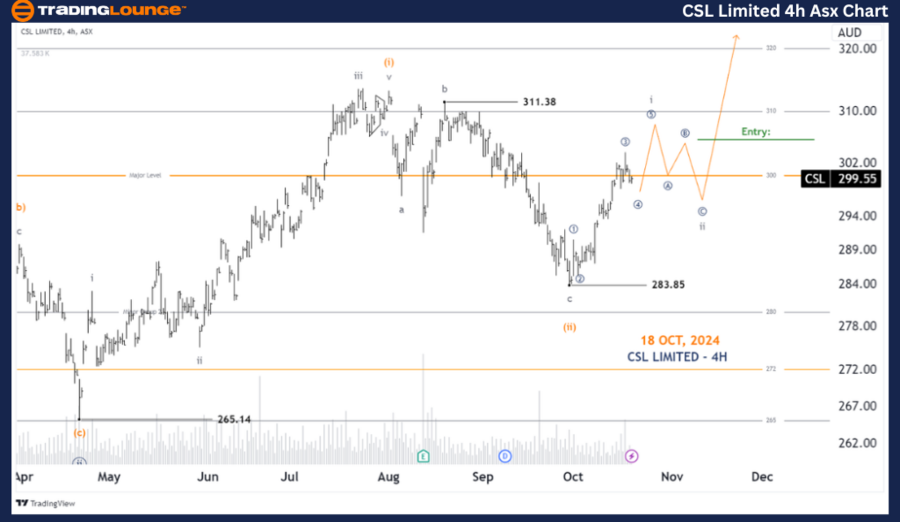
ASX: CSL LIMITED - 4-Hour Chart Analysis

Function: Major Trend (Minute Degree, Navy)

Mode: Motive

Structure: Impulse

Position: Wave ((4))-navy of wave i-grey of Wave (iii)-orange

Details: From the low at 283.85, a five-wave structure is emerging, possibly indicating we are in wave ((4))-navy. Once wave ((5))-navy completes, it will mark the end of i-grey. Following this, wave ii-grey should push lower, and a Long Trade Setup will be sought after the price confirms support at the Major Level 300.00 by staying above it.

Invalidation Point: 283.85

Technical Analyst: Hua (Shane) Cuong, CEWA-M (Master’s Designation).

Source: visit Tradinglounge.com and learn From the Experts Join TradingLounge Here 

See Previous: Fisher & Paykel Healthcare Elliott Wave Technical Analysis

VALUE Offer - Buy 1 Month & Get 3 Months!Click here

Access 7 Analysts Over 200 Markets Covered. Chat Room With Support

CSL-LIMITED-4H-Asx-C...


Conclusion:

Our analysis of CSL LIMITED (ASX: CSL) provides insight into both long-term and short-term market trends, highlighting key levels and wave structures. We emphasize price points that serve as validation or invalidation markers to strengthen confidence in our wave count. By offering this comprehensive analysis, we aim to help traders identify profitable opportunities while maintaining an objective and professional approach to market trends.

Related

British Pound/Japanese Yen (GBPJPY) Forex Elliott Wave Technical Analysis: Analyzing Daily or 4-hour Charts for Effective Trading

British Pound/Japanese Yen (GBPJPY) Forex Elliott Wave Technical Analysis: Analyzing Daily or 4-hour Charts for Effective Trading

This article provides an in-depth GBPJPY Elliott Wave analysis, focusing on counter-trend and bearis...

Read More >
Expert EURGBP Elliott Wave Analysis: Uncover Trends, Forecasts, and Proven Trading Strategies for Success

Expert EURGBP Elliott Wave Analysis: Uncover Trends, Forecasts, and Proven Trading Strategies for Success

This article provides an in-depth EURGBP Elliott Wave analysis, focusing on the current wave count, ...

Read More >
Offering Traders Valuable Guidance on AVY's Market Trajectory: Avery Dennison Corp. Stocks Elliott Wave Technical Analysis

Offering Traders Valuable Guidance on AVY's Market Trajectory: Avery Dennison Corp. Stocks Elliott Wave Technical Analysis

This article provides a comprehensive Elliott Wave analysis of Avery Dennison Corp. (AVY). It covers...

Read More >
WTI Crude Oil Forecast and Elliott Wave Technical Analysis - Market Trends and Trading Strategies

WTI Crude Oil Forecast and Elliott Wave Technical Analysis - Market Trends and Trading Strategies

Explore in-depth Elliott Wave analysis of WTI crude oil, including current market trends, price pred...

Read More >
Elliott Wave Technical Analysis for AbbVie Stock: Forecast, Price Prediction, and Trading Opportunities

Elliott Wave Technical Analysis for AbbVie Stock: Forecast, Price Prediction, and Trading Opportunities

This detailed AbbVie stock analysis applies Elliott Wave theory to assess the stock's current pr...

Read More >
Texas Instruments Inc. Stock Analysis - TXN Elliott Wave Technical Analysis Shows key resistance levels and Stock Movements

Texas Instruments Inc. Stock Analysis - TXN Elliott Wave Technical Analysis Shows key resistance levels and Stock Movements

This analysis provides a detailed look at Texas Instruments Inc. (TXN) through the lens of Elliott W...

Read More >

Buy 1 Month

Get 3 Months!

Special Offer:

Trade Recommendations

Unleash the power of deversified trading with our comprehensive portfolio, covering:

  • Stock Trades
  • Crypto Trades
  • Forex Trades
  • Commodity Trades
Elliott Wave Analysis

Gain a competive edge with expert insights in to:

  • Global Indices
  • US Stocks & ASX Stocks
  • Forex & Crypto
  • Commodities
Top-Notch Trading Tools

Equip yourself with the tools of success:

  • Social Chat
  • Elliott Wave Algorithm
  • Screener
  • TradingLevels
  • Trading Game
7 Elliott Wave Analysts

Stay ahead of the market with daily charts and insightful videos
-Your secret to strategic trading!

JOIN HERE


Welcome to TradingLounge (ASIC A.R.No. 321187), specialists in trades, trading education and technical analysis, covering stocks, indices, commodities, forex and cryptocurrencies.

When you join TradingLounge you have access to everything we offer, including trade tools, educational content and a social platform to chat with like-minded investors.

Read more

@Copyright 2024 by tradinglounge.com

Contact Us

Australian no: 02 4787 6020

International no: +61 (2) 47876020

Pay with:

Find us on