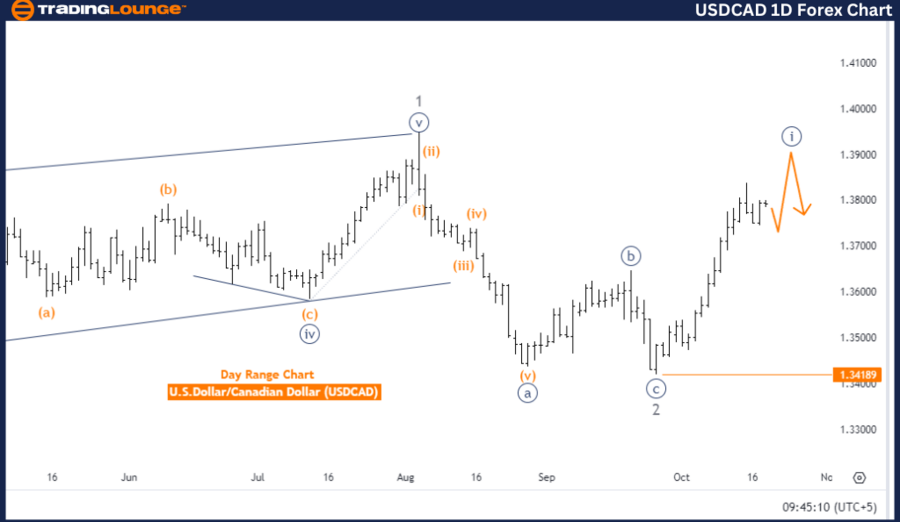
USDCAD Elliott Wave Analysis - Trading Lounge Day Chart
U.S. Dollar / Canadian Dollar (USDCAD) Day Chart Analysis
USDCAD Elliott Wave Technical Analysis
Function: Trend
Mode: Impulsive
Structure: Navy blue wave 1
Position: Gray wave 3
Next Lower Degree Direction: Navy blue wave 2
Wave Cancellation/Invalidation Level: 1.34189
The USDCAD Elliott Wave analysis on the day chart highlights an impulsive trend, suggesting strong bullish momentum. The focus is on navy blue wave 1, which is a part of the larger gray wave 3.
Currently, the market is positioned within gray wave 3, and navy blue wave 1 remains active. This indicates that the upward trend continues, with the market likely to complete this phase before moving into the next segment of the wave cycle. The ongoing navy blue wave 1 shows sustained bullish activity, representing the core of the impulsive wave structure.
The next expected phase is navy blue wave 2, a potential corrective phase after the current impulsive wave completes. This could lead to a brief pullback or consolidation period before the upward trend resumes in the next wave. However, for now, navy blue wave 1 remains in play, pointing to further upward movement in the near term.
An important level to watch is the wave invalidation level at 1.34189. If the price falls below this level, the current Elliott Wave count would be invalidated, necessitating a reevaluation of the market’s wave structure. As long as the price stays above this level, the bullish trend within navy blue wave 1 of gray wave 3 is likely to persist.
Summary:
- USDCAD remains in an impulsive phase, with navy blue wave 1 of gray wave 3 still in progress.
- The market is following an upward trend, with an invalidation level at 1.34189.
- The next phase could involve a corrective movement in navy blue wave 2.
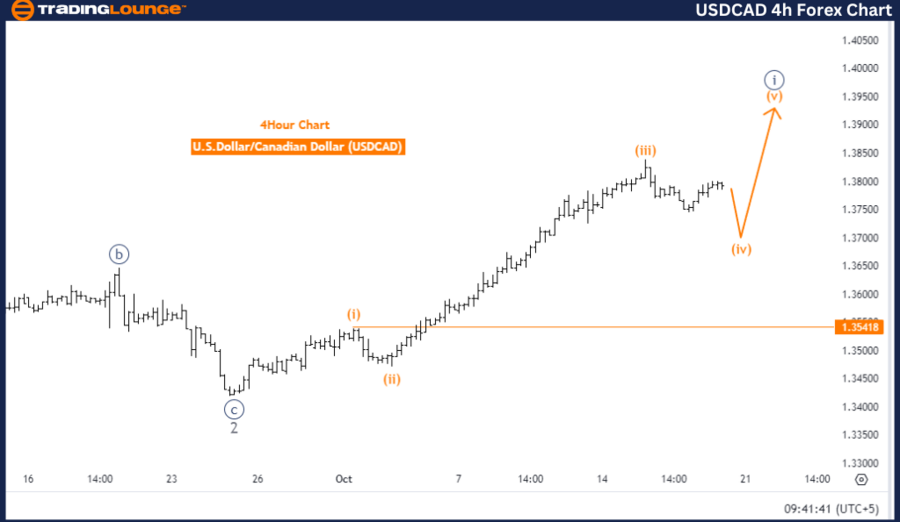
U.S. Dollar / Canadian Dollar (USDCAD) 4-Hour Chart
USDCAD Forex Pair Technical Analysis
Function: Counter Trend
Mode: Corrective
Structure: Orange wave 4
Position: Navy blue wave 1
Next Higher Degree Direction: Orange wave 5
Wave Cancellation/Invalidation Level: 1.35418
The USDCAD Elliott Wave analysis on the 4-hour chart indicates a counter-trend setup, focusing on a corrective pattern. The primary wave of interest is orange wave 4, signaling a corrective phase after the completion of the impulsive orange wave 3.
The analysis shows that orange wave 3 has concluded, and the market is currently moving through orange wave 4. This wave typically represents a retracement or consolidation period before the upward movement resumes with orange wave 5.
At this point, the market is within navy blue wave 1, which is part of orange wave 4, marking the beginning of the corrective phase. This phase is expected to serve as a temporary retracement before the market continues higher in orange wave 5.
A crucial level to monitor is the wave cancellation level at 1.35418. If the price drops below this level, the current wave count would be invalidated, and the analysis would need to be revisited. As long as the price holds above this level, the corrective phase of orange wave 4 is likely to persist, with an eventual upward movement expected in orange wave 5.
Summary:
- USDCAD is in a corrective phase, with orange wave 4 currently in progress after orange wave 3.
- The market is retracing or consolidating during this corrective phase.
- The invalidation level is at 1.35418, with upward movement expected after orange wave 4 concludes, leading into orange wave 5.
Technical Analyst: Malik Awais
Source: visit Tradinglounge.com and learn From the Experts Join TradingLounge Here
Previous: Euro/British Pound (EURGBP) Elliott Wave Technical Analysis
VALUE Offer - Buy 1 Month & Get 3 Months!Click here
Access 7 Analysts Over 200 Markets Covered. Chat Room With Support