Corn Commodity Elliott Wave Technical Analysis

Corn is currently in a retracement phase from the decline that began on October 2nd. If the price does not break above the high of October 2, the commodity may experience further downward movement in the coming weeks, continuing the broader bearish cycle that started in May 2024. If the current rebound fails to surpass the October 2 high and breaks below the October 17 low, sellers are likely to dominate the market for weeks or even months.

Long-Term Elliott Wave View on Corn

In the long term, Corn prices are in a bearish corrective phase that began in July 2012. This phase is correcting the diagonal 5-wave sequence that started in the 1970s. Corrective structures, apart from triangles, are typically composed of three waves. The first wave of this corrective phase completed in April 2020, followed by strong rallies that completed the second wave in April 2022. The current decline, starting from April 2022, is expected to represent the third wave, which could extend to $295. Therefore, the corrective phase remains incomplete, and further price declines are anticipated.

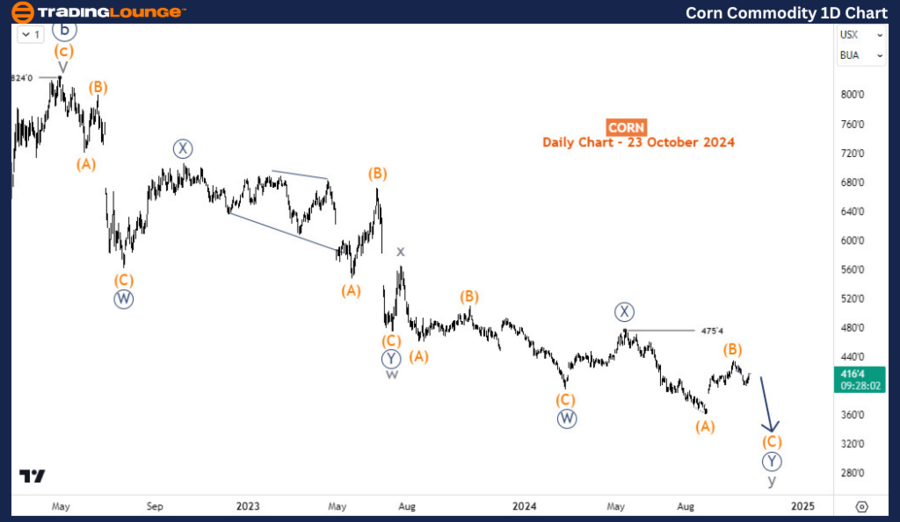
Corn Commodity Daily Chart Analysis

On the daily chart, the focus is on the third wave, which began from the 824 level. This wave appears to be evolving into a double zigzag pattern, labeled in the cycle degree. After completing waves W and X in the cycle degree, Corn is now in wave Y. However, wave Y is still incomplete, as it is currently in wave (C) of ((Y)) of Y. Wave (B) could still extend higher but is expected to remain below the 475 level. To confirm the end of wave (B), traders need to see the first lower low sequence on the H4 chart.

Corn-Commodity-1D-Ch...


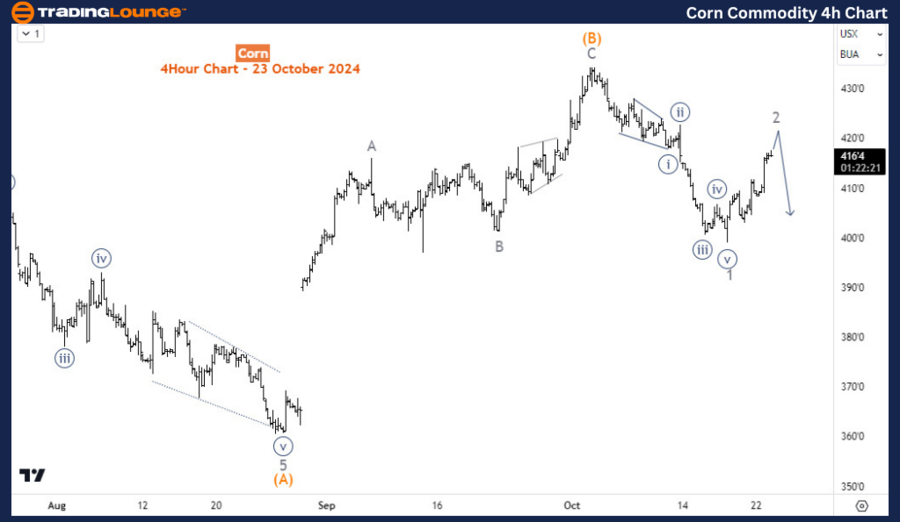
Corn Commodity H4 Chart Outlook

On the H4 chart, a five-wave bearish reaction has emerged following the completion of wave (B). The current rally represents wave 2 of (C). For confirmation that wave (B) will not push higher, wave 3 needs to begin below the high of wave (B) and break below the low of wave 1, which occurred on October 17.

Technical Analyst: Sanmi Adeagbo

Source: visit Tradinglounge.com and learn From the Experts Join TradingLounge Here 

See Previous: Silver Elliott Wave Technical Analysis

VALUE Offer - Buy 1 Month & Get 3 Months!Click here

Access 7 Analysts Over 200 Markets Covered. Chat Room With Support

Corn-Commodity-4h-Ch...

Related

Unlocking ASX Trading Success: SANTOS LIMITED – STO Stock Analysis & Elliott Wave Technical Forecast

Unlocking ASX Trading Success: SANTOS LIMITED – STO Stock Analysis & Elliott Wave Technical Forecast

Our comprehensive analysis of Santos Limited (ASX: STO) includes the latest Elliott Wave forecast an...

Read More >
Deere & Co. (DE) Stocks Elliott Wave Technical Analysis: Bullish Trends, and Actionable Insights into Potential Price Movements

Deere & Co. (DE) Stocks Elliott Wave Technical Analysis: Bullish Trends, and Actionable Insights into Potential Price Movements

This comprehensive Elliott Wave analysis for Deere & Co (DE) covers daily and 1-hour chart structure...

Read More >
Euro/ U.S. Dollar (EURUSD) Forex Elliott Wave Technical Analysis:  Detailed insights into the current market trends

Euro/ U.S. Dollar (EURUSD) Forex Elliott Wave Technical Analysis: Detailed insights into the current market trends

This article provides a comprehensive Elliott Wave Analysis of the EURUSD pair, covering both day an...

Read More >
Unlocking the Secrets of Gold Trading: A Comprehensive Guide to Elliott Wave Analysis and Strategies

Unlocking the Secrets of Gold Trading: A Comprehensive Guide to Elliott Wave Analysis and Strategies

Our detailed guide explores the Gold Elliott Wave Analysis for the year 2024, providing traders and ...

Read More >
Impulse Wave iii) Topping—Elliott Wave Analysis of Major Indices and Tech Stocks

Impulse Wave iii) Topping—Elliott Wave Analysis of Major Indices and Tech Stocks

The strong upward movement in major stock indices and tech stocks suggests that impulse wave iii) ma...

Read More >
U.S.Dollar/Japanese Yen(USDJPY) Forex Elliott Wave Technical Analysis: Impulsive Trends and Key Levels to Watch

U.S.Dollar/Japanese Yen(USDJPY) Forex Elliott Wave Technical Analysis: Impulsive Trends and Key Levels to Watch

Elliott Wave analysis of the USDJPY currency pair highlights the current trend, explains the impulsi...

Read More >

Buy 1 Month

Get 3 Months!

Special Offer:

Trade Recommendations

Unleash the power of deversified trading with our comprehensive portfolio, covering:

  • Stock Trades
  • Crypto Trades
  • Forex Trades
  • Commodity Trades
Elliott Wave Analysis

Gain a competive edge with expert insights in to:

  • Global Indices
  • US Stocks & ASX Stocks
  • Forex & Crypto
  • Commodities
Top-Notch Trading Tools

Equip yourself with the tools of success:

  • Social Chat
  • Elliott Wave Algorithm
  • Screener
  • TradingLevels
  • Trading Game
7 Elliott Wave Analysts

Stay ahead of the market with daily charts and insightful videos
-Your secret to strategic trading!

JOIN HERE


Welcome to TradingLounge (ASIC A.R.No. 321187), specialists in trades, trading education and technical analysis, covering stocks, indices, commodities, forex and cryptocurrencies.

When you join TradingLounge you have access to everything we offer, including trade tools, educational content and a social platform to chat with like-minded investors.

Read more

@Copyright 2024 by tradinglounge.com

Contact Us

Australian no: 02 4787 6020

International no: +61 (2) 47876020

Pay with:

Find us on