24Oct

CAC 40 Elliott Wave Technical Analysis: Discover the Best Strategies for Trading the France Index, Get Forecasts, and Stay Updated

CAC 40 (France) Elliott Wave Analysis Trading Lounge Day Chart

CAC 40 (France) Index Day Chart Analysis

CAC 40 (France) Elliott Wave Technical Analysis

  • Function: Counter Trend

  • Mode: Corrective

  • Structure: Gray wave 2

  • Position: Orange wave 3

  • Next Higher Degrees Direction: Gray wave 3

  • Details: Gray wave 1 completed; gray wave 2 of orange wave 3 now in progress.

  • Wave Cancel Invalidation Level: 7,031.04

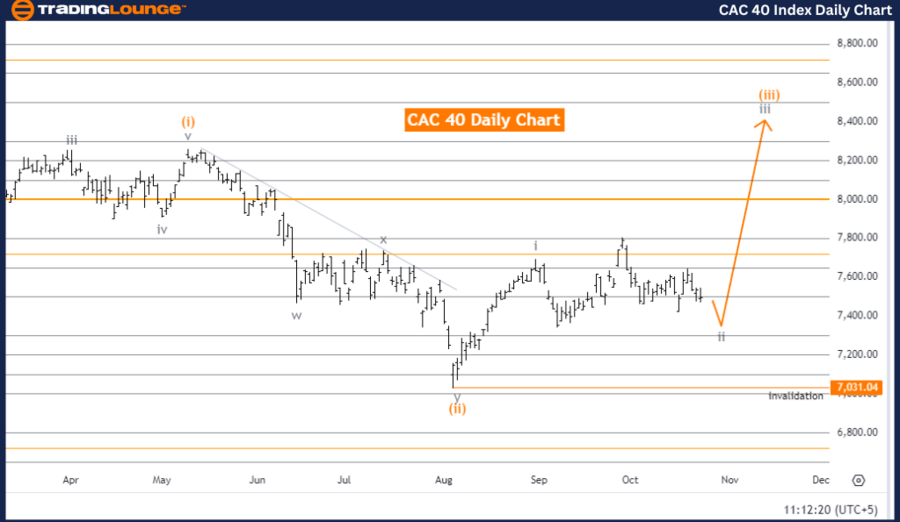
The Elliott Wave analysis for the CAC 40 daily chart shows the market in a corrective phase, reflecting a counter-trend movement. The focus is on gray wave 2, which follows the completion of gray wave 1. With gray wave 1 finished, the market is now developing gray wave 2 within orange wave 3, signaling a short-term pullback before resuming its upward trend.

Currently, the market resides within orange wave 3, part of a larger bullish cycle. Gray wave 2, acting as a corrective phase, signals a temporary decline before moving upward into gray wave 3, the next stage in the Elliott Wave sequence.

The higher degree trend anticipates gray wave 3, implying that once the corrective gray wave 2 is complete, the market will likely resume its bullish momentum. The wave cancellation invalidation level is set at 7,031.04, meaning if the price falls below this level, the wave count becomes invalid, prompting a need to reassess the structure.

Summary: The CAC 40 daily Elliott Wave analysis indicates that gray wave 1 is complete, and gray wave 2 is unfolding within orange wave 3. This corrective phase is expected to conclude before the market resumes its upward trend toward gray wave 3. The structure remains valid unless the price drops below 7,031.04.

CAC-40-Index-DailyCh...


CAC 40 (France) Elliott Wave Analysis Trading Lounge Weekly Chart

CAC 40 (France) Elliott Wave Technical Analysis

  • Function: Bullish Trend

  • Mode: Impulsive

  • Structure: Orange wave 3

  • Position: Navy blue wave 3

  • Next Lower Degrees Direction: Orange wave 4

  • Details: Orange wave 2 completed; orange wave 3 of 3 in progress.

  • Wave Cancel Invalidation Level: 7,031.04

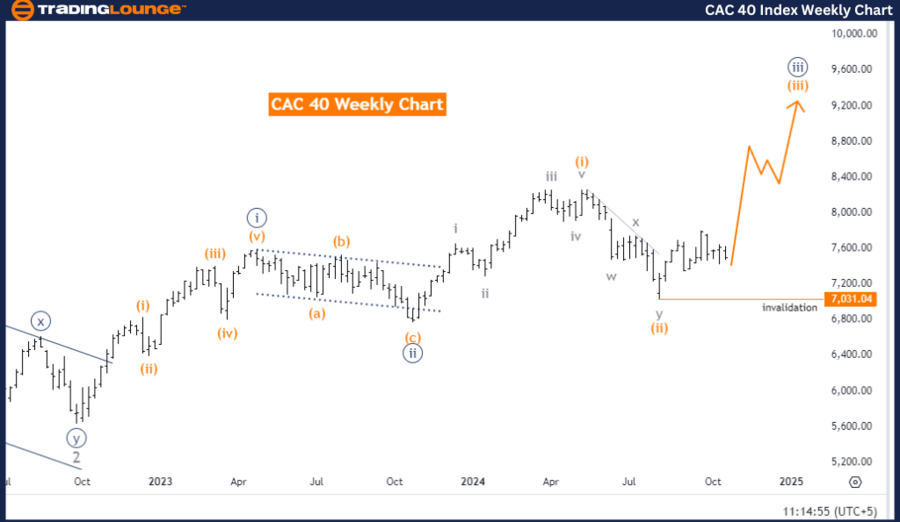
The CAC 40 weekly chart's Elliott Wave analysis shows the market in a bullish trend, moving through an impulsive wave structure. The main wave under analysis is orange wave 3, which is part of a broader upward movement. The market is currently positioned within navy blue wave 3, indicating a strong upward phase.

Orange wave 2 is complete, and orange wave 3 of 3 is currently unfolding. Typically, wave 3 in an impulsive sequence represents the most substantial price movement, suggesting that the market is likely to maintain its bullish momentum during this phase.

Following the completion of orange wave 3, the next expected wave is orange wave 4, a corrective phase that will likely occur after the current upward move concludes.

The invalidation level for this wave structure is set at 7,031.04. Should the price fall below this level, the current Elliott Wave count would become invalid, necessitating a reevaluation of the wave pattern.

Technical Analyst: Malik Awais

Source: visit Tradinglounge.com and learn From the Experts Join TradingLounge Here 

Previous: S&P BSE Sensex (India) Elliott Wave Technical Analysis

VALUE Offer - Buy 1 Month & Get 3 Months!Click here

Access 7 Analysts Over 200 Markets Covered. Chat Room With Support

CAC-40-Index-WeeklyC...


Conclusion:

The CAC 40 weekly Elliott Wave analysis reflects a bullish trend, with orange wave 3 in progress and orange wave 2 already completed. The market is advancing within navy blue wave 3, with a corrective orange wave 4 anticipated in the future. The wave structure remains valid as long as the price stays above 7,031.04.

Related

Iron Ore Commodity Elliott Wave Technical Analysis: Market Trends and Price Outlook for 2024

Iron Ore Commodity Elliott Wave Technical Analysis: Market Trends and Price Outlook for 2024

The SGX TSI Iron Ore Index has become an essential benchmark for market participants in iron ore tra...

Read More >
Euro Stoxx 50 Index Elliott Wave Technical Analysis: Discover the best stocks to buy, understand the latest trends

Euro Stoxx 50 Index Elliott Wave Technical Analysis: Discover the best stocks to buy, understand the latest trends

Unlock the full potential of your Euro Stoxx 50 investments with our detailed trading strategies, El...

Read More >
S&P 500 Index Elliott Wave Technical Analysis: Detailed Daily and Weekly Market Trends

S&P 500 Index Elliott Wave Technical Analysis: Detailed Daily and Weekly Market Trends

This article provides a thorough Elliott Wave analysis of the S&P 500, focusing on both daily and we...

Read More >
NEO/ U.S. dollar(NEOUSD) Elliott Wave Technical Analysis 6 December 23

NEO/ U.S. dollar(NEOUSD) Elliott Wave Technical Analysis 6 December 23

NEO/ U.S. dollar(NEOUSD) Elliott Wave Technical Analysis dated 6 December 23, offers an in-depth per...

Read More >
Exploring ASX Trading Success: ASX LIMITED – ASX Stock Analysis & Elliott Wave Technical Forecast

Exploring ASX Trading Success: ASX LIMITED – ASX Stock Analysis & Elliott Wave Technical Forecast

Dive deep into the financial waters of ASX Limited with our detailed analysis. Leveraging Elliott Wa...

Read More >
Elliott Wave Analysis and Trading Strategies for NASDAQ and Major Tech Stocks

Elliott Wave Analysis and Trading Strategies for NASDAQ and Major Tech Stocks

This week, our Elliott Wave analysis tracks two bullish counts for the NASDAQ 100 (NDX) and key tech...

Read More >

Buy 1 Month

Get 3 Months!

Special Offer:

Trade Recommendations

Unleash the power of deversified trading with our comprehensive portfolio, covering:

  • Stock Trades
  • Crypto Trades
  • Forex Trades
  • Commodity Trades
Elliott Wave Analysis

Gain a competive edge with expert insights in to:

  • Global Indices
  • US Stocks & ASX Stocks
  • Forex & Crypto
  • Commodities
Top-Notch Trading Tools

Equip yourself with the tools of success:

  • Social Chat
  • Elliott Wave Algorithm
  • Screener
  • TradingLevels
  • Trading Game
7 Elliott Wave Analysts

Stay ahead of the market with daily charts and insightful videos
-Your secret to strategic trading!

JOIN HERE


Welcome to TradingLounge (ASIC A.R.No. 321187), specialists in trades, trading education and technical analysis, covering stocks, indices, commodities, forex and cryptocurrencies.

When you join TradingLounge you have access to everything we offer, including trade tools, educational content and a social platform to chat with like-minded investors.

Read more

@Copyright 2024 by tradinglounge.com

Contact Us

Australian no: 02 4787 6020

International no: +61 (2) 47876020

Pay with:

Find us on