GX Uranium ETF Commodity Elliott Wave Technical Analysis

GX Uranium ETF Elliott Wave Analysis

The Global X Uranium ETF (GX URA) offers investors exposure to the uranium sector, focusing on companies involved in uranium mining, exploration, and production worldwide. As nuclear energy gains momentum as a cleaner power source, the demand for uranium may increase, making the GX URA ETF an attractive option for investors looking to capitalize on the sector's growth potential.

Long-Term Elliott Wave Analysis

Analyzing the GX URA ETF from an Elliott Wave perspective reveals a sustained bullish correction following a significant downtrend. Between February 2011 and March 2020, the ETF's price consistently declined, establishing lower lows and lower highs in line with an extended impulse wave pattern. This prolonged downtrend ended in March 2020, with a recovery sequence beginning shortly after.

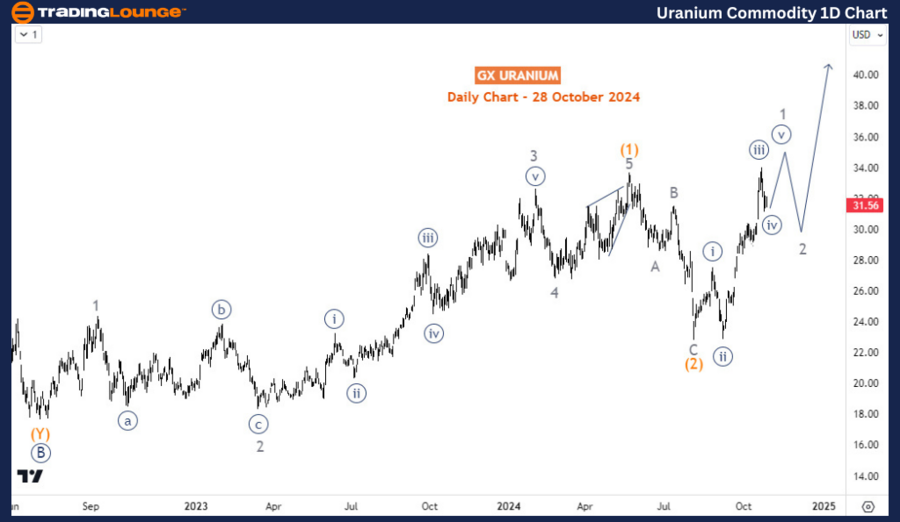
GX Uranium ETF Commodity Daily Chart Analysis

After this low, the ETF completed an impulsive wave A (circled) of the primary degree by November 2021, initiating the first phase of a larger corrective pattern. Subsequently, a corrective pullback emerged as wave B (circled), which concluded in July 2022. From this point, an impulsive structure shaped wave (1) of C (circled), peaking in May 2024. A pullback then formed as wave (2) on the daily chart, leading to a rally starting on August 5, 2024. This rally likely represents the initial development of wave 1 of (3), marking the next phase of the bullish recovery. As wave 1 is still forming, the ETF holds substantial upside potential within this corrective structure.

Uranium-Commodity-1D...


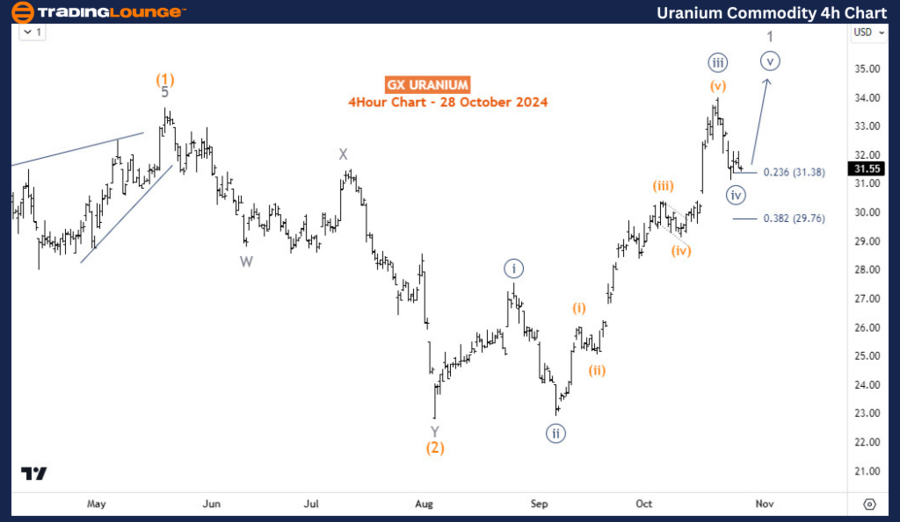
GX Uranium ETF Commodity H4 Chart Analysis

Zooming in on the H4 timeframe, the impulsive recovery beginning August 5th broke above the high of wave (1), confirming that wave (3) has commenced following the completion of wave (2) at August's low. This surge aligns with wave 1 of (3) as projected, though wave 1 remains ongoing. Last week's pullback suggests the ETF is presently in wave ((iv)) of 1, hinting at one final upward push in wave ((v)) of 1 before a more considerable pullback unfolds in wave 2. This expected move presents attractive opportunities for investors as the long-term bullish correction progresses.

Technical Analyst: Sanmi Adeagbo

Source: visit Tradinglounge.com and learn From the Experts Join TradingLounge Here 

See Previous: Wheat Elliott Wave Technical Analysis

VALUE Offer - Buy 1 Month & Get 3 Months!Click here

Access 7 Analysts Over 200 Markets Covered. Chat Room With Support

Uranium-Commodity-4h...

Related

Costco Wholesale Corp. (COST) Elliott Wave Technical Analysis: Stock's Recent Price Movements, Potential Trading Opportunities

Costco Wholesale Corp. (COST) Elliott Wave Technical Analysis: Stock's Recent Price Movements, Potential Trading Opportunities

This article provides a detailed Elliott Wave analysis for Costco Wholesale Corp. (COST) as of July ...

Read More >
Learn about Ethereum's Crypto Price uptrend and downtrend indicators: ETHUSD Elliott Wave Technical Analysis

Learn about Ethereum's Crypto Price uptrend and downtrend indicators: ETHUSD Elliott Wave Technical Analysis

This analysis provides a detailed overview of Ethereum price prediction using Elliott Wave Theory. I...

Read More >
Our Detailed Elliott Wave Technical Analysis of ASX: SCG Offers Insights into Scentre Group's Stock Movements

Our Detailed Elliott Wave Technical Analysis of ASX: SCG Offers Insights into Scentre Group's Stock Movements

Our detailed Elliott Wave analysis of ASX: SCG offers insights into Scentre Group's stock moveme...

Read More >
Amazon Inc.(AMZN) Stocks Elliott Wave Analysis: A Comprehensive Technical Overview

Amazon Inc.(AMZN) Stocks Elliott Wave Analysis: A Comprehensive Technical Overview

This detailed analysis provides an in-depth look into Amazon.com Inc. (AMZN) through the lens of Ell...

Read More >
Reece Limited - REH Stock Analysis & Elliott Wave Technical Analysis of REH's Impulse Waves, Expected Support and Resistance Levels

Reece Limited - REH Stock Analysis & Elliott Wave Technical Analysis of REH's Impulse Waves, Expected Support and Resistance Levels

Our detailed Elliott Wave analysis of Reece Limited (REH) on the ASX provides key insights into curr...

Read More >
Unlocking the Future of Corn Prices: An Elliott Wave Technical Analysis of Corn Commodity

Unlocking the Future of Corn Prices: An Elliott Wave Technical Analysis of Corn Commodity

This comprehensive guide provides an in-depth analysis of corn prices and market trends for 2024 thr...

Read More >

Buy 1 Month

Get 3 Months!

Special Offer:

Trade Recommendations

Unleash the power of deversified trading with our comprehensive portfolio, covering:

  • Stock Trades
  • Crypto Trades
  • Forex Trades
  • Commodity Trades
Elliott Wave Analysis

Gain a competive edge with expert insights in to:

  • Global Indices
  • US Stocks & ASX Stocks
  • Forex & Crypto
  • Commodities
Top-Notch Trading Tools

Equip yourself with the tools of success:

  • Social Chat
  • Elliott Wave Algorithm
  • Screener
  • TradingLevels
  • Trading Game
7 Elliott Wave Analysts

Stay ahead of the market with daily charts and insightful videos
-Your secret to strategic trading!

JOIN HERE


Welcome to TradingLounge (ASIC A.R.No. 321187), specialists in trades, trading education and technical analysis, covering stocks, indices, commodities, forex and cryptocurrencies.

When you join TradingLounge you have access to everything we offer, including trade tools, educational content and a social platform to chat with like-minded investors.

Read more

@Copyright 2024 by tradinglounge.com

Contact Us

Australian no: 02 4787 6020

International no: +61 (2) 47876020

Pay with:

Find us on