08Dec

Texas Instruments Inc.(TXN:NASDAQ) Elliott Wave Technical Analysis 8 December 23

Texas Instruments Inc., Elliott Wave Technical Analysis

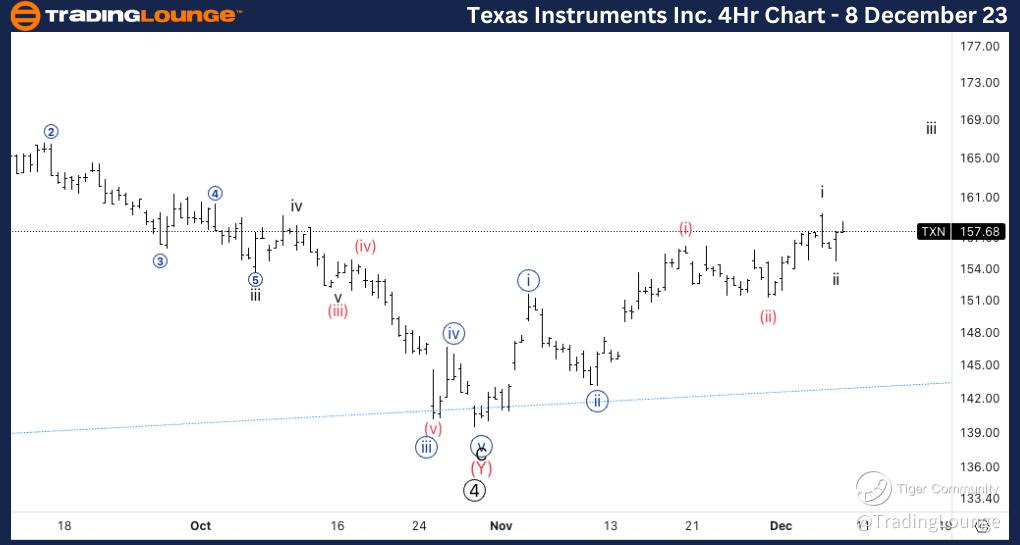
Texas Instruments Inc., (TXN:NASDAQ): 4h Chart 8 December 23

TXN Stock Market Analysis: We have been looking for upside into wave (iii) with the previous update and we have successfully continued higher. We are now seeing resistance at the end of Minor Group 2 as we could enter a potential wave ii.  

TXN Elliott Wave Count: Wave ii of (iii).

TXN Technical Indicators: 200EMA as resistance

TXN Trading Strategy: Looking for longs after a break and retest of 158$.  

TradingLounge Analyst: Alessio Barretta

Source: Tradinglounge.com get trial here!

TXN-4Hr-Stock-Chart-...


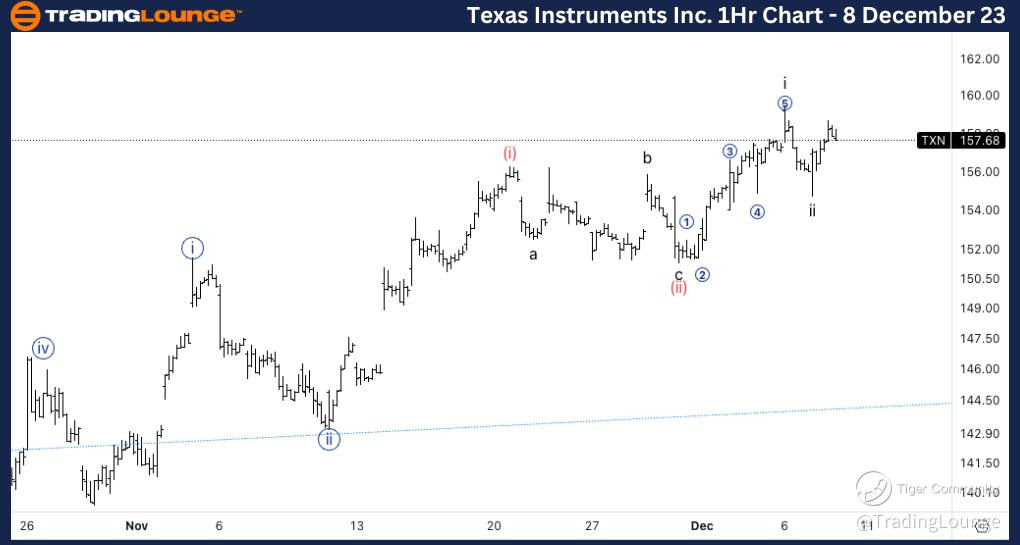
Texas Instruments Inc., TXN: 1-hour Chart 8 December 23

Texas Instruments Inc., Elliott Wave Technical Analysis 

TXN Stock Market Analysis: We are looking for either a wave ii in place of wave a of ii completed. Looking for further upside into wave ii as long as 155 keeps holding as support and we break through the end of Minor Group 2.  

TXN Elliott Wave count:  Wave ii of (iii)

TXN Technical Indicators: Above all averages.

TXN Trading Strategy: Looking for longs after a break and retest of 158$.

TXN-1Hr-Stock-Chart-...

Related

Bovespa Index Elliott Wave Analysis: Bovespa Stock Picks, and a Technical View on Bullish and Bearish Signals in the Index Market

Bovespa Index Elliott Wave Analysis: Bovespa Stock Picks, and a Technical View on Bullish and Bearish Signals in the Index Market

This in-depth guide on Bovespa Index analysis covers essential trading insights, Elliott Wave interp...

Read More >
ANZ stock performance with Technical Analysis and Price Targets: Elliott Wave Analysis for ANZ Group Holdings Limited

ANZ stock performance with Technical Analysis and Price Targets: Elliott Wave Analysis for ANZ Group Holdings Limited

Our comprehensive Elliott Wave analysis for ANZ Group Holdings Limited on the Australian Stock Excha...

Read More >
Bitcoin/U.S. dollar(BTCUSD) Elliott Wave Technical Analysis 29 January 24

Bitcoin/U.S. dollar(BTCUSD) Elliott Wave Technical Analysis 29 January 24

Bitcoin and U.S. dollar(BTCUSD) Elliott Wave Technical Analysis dated 29 January 24, Day and 4-hour ...

Read More >
ASX Trading Success: CSL LIMITED – CSL Stock Analysis & Elliott Wave Technical | Forecast key price targets

ASX Trading Success: CSL LIMITED – CSL Stock Analysis & Elliott Wave Technical | Forecast key price targets

This comprehensive Elliott Wave analysis of CSL LIMITED on the Australian Stock Exchange (ASX) provi...

Read More >
Euro/British Pound(EURGBP) 4 Hour Chart Elliott Wave Technical Analysis 15 November 23

Euro/British Pound(EURGBP) 4 Hour Chart Elliott Wave Technical Analysis 15 November 23

Euro/British Pound(EURGBP) 4 Hour Chart Elliott Wave Technical Analysis 15 November 23 offers an in-...

Read More >

Buy 1 Month

Get 3 Months!

Special Offer:

Trade Recommendations

Unleash the power of deversified trading with our comprehensive portfolio, covering:

  • Stock Trades
  • Crypto Trades
  • Forex Trades
  • Commodity Trades
Elliott Wave Analysis

Gain a competive edge with expert insights in to:

  • Global Indices
  • US Stocks & ASX Stocks
  • Forex & Crypto
  • Commodities
Top-Notch Trading Tools

Equip yourself with the tools of success:

  • Social Chat
  • Elliott Wave Algorithm
  • Screener
  • TradingLevels
  • Trading Game
7 Elliott Wave Analysts

Stay ahead of the market with daily charts and insightful videos
-Your secret to strategic trading!

JOIN HERE


Welcome to TradingLounge (ASIC A.R.No. 321187), specialists in trades, trading education and technical analysis, covering stocks, indices, commodities, forex and cryptocurrencies.

When you join TradingLounge you have access to everything we offer, including trade tools, educational content and a social platform to chat with like-minded investors.

Read more

@Copyright 2024 by tradinglounge.com

Contact Us

Australian no: 02 4787 6020

International no: +61 (2) 47876020

Pay with:

Find us on