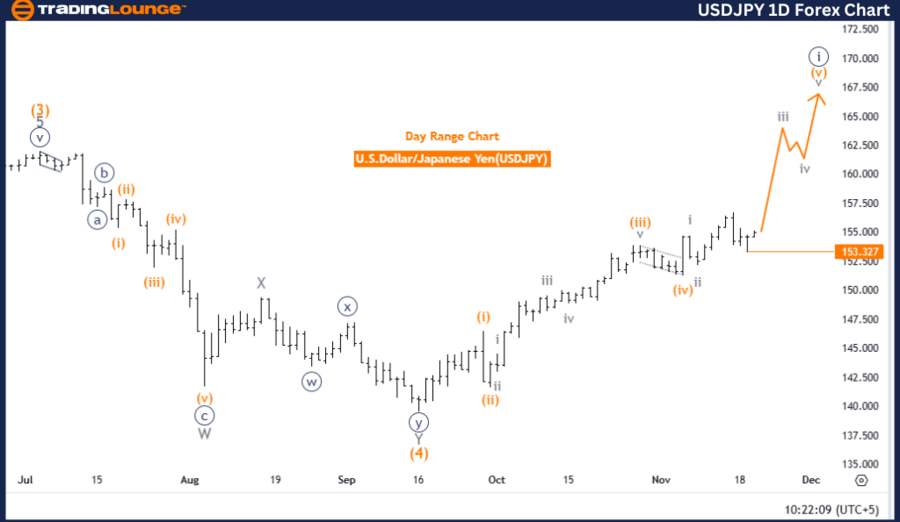
USDJPY Elliott Wave Analysis - Trading Lounge Day Chart
U.S. Dollar / Japanese Yen (USDJPY) Day Chart
USDJPY Elliott Wave Technical Analysis
Function: Bullish Trend
Mode: Impulsive
Structure: Orange Wave 5
Position: Navy Blue Wave 1
Direction (Next Lower Degrees): Navy Blue Wave 2
Details: Orange Wave 4 appears completed; Orange Wave 5 of 1 is underway.
Wave Cancel Invalidation Level: 152.327
The USDJPY daily chart analysis highlights a bullish trend, characterized by an impulsive Elliott Wave structure. The current focus is on Orange Wave 5, a segment of Navy Blue Wave 1, indicating an upward trajectory in the market.
The completion of Orange Wave 4 has paved the way for the ongoing development of Orange Wave 5. This wave typically represents the final upward thrust in an impulsive sequence, signaling strong bullish momentum before transitioning into a corrective phase.
Upon the conclusion of Orange Wave 5, the next anticipated movement is Navy Blue Wave 2, consistent with the Elliott Wave principle, which alternates between impulsive and corrective phases in cyclical market patterns.
An important invalidation level is set at 152.327. If prices drop to or below this level, it will invalidate the current wave count, suggesting a potential shift in trend or market structure. This level serves as a key point for traders to assess the accuracy of the wave structure and manage risks effectively.
Summary:
The USDJPY daily chart underscores a bullish trend, with Orange Wave 5 of Navy Blue Wave 1 currently unfolding after the completion of Orange Wave 4. The market's trajectory aligns with the impulsive trend, emphasizing further upside potential. Traders should monitor the invalidation level of 152.327 to ensure alignment with the bullish outlook and validate trading strategies accordingly.
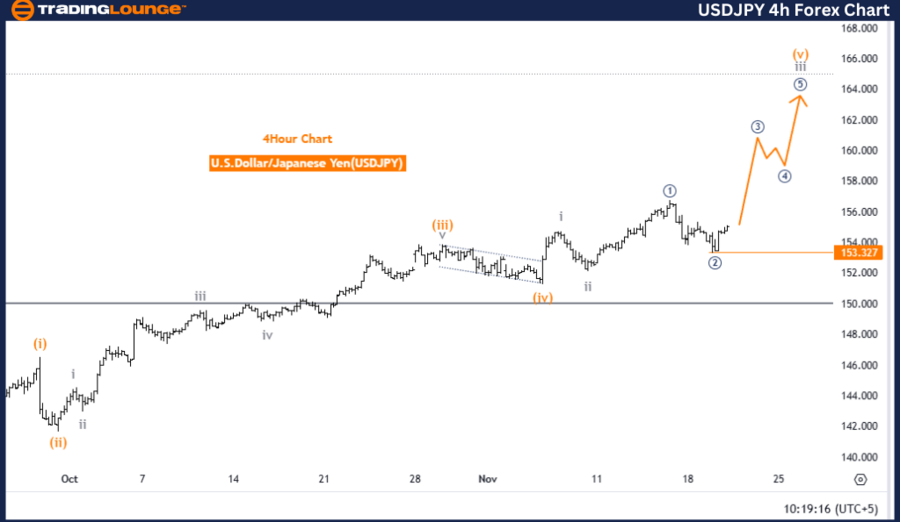
U.S. Dollar / Japanese Yen (USDJPY) 4-Hour Chart
USDJPY Elliott Wave Technical Analysis
Function: Bullish Trend
Mode: Impulsive
Structure: Gray Wave 3
Position: Orange Wave 5
Direction (Next Lower Degrees): Gray Wave 4
Details: Gray Wave 2 appears completed; Gray Wave 3 is currently unfolding.
Wave Cancel Invalidation Level: 152.327
The USDJPY 4-hour chart analysis also demonstrates a bullish trend in line with the Elliott Wave framework. The ongoing focus is on Gray Wave 3, an impulsive wave within the larger upward trend. The current wave resides in Orange Wave 5, showcasing continued momentum in the market.
The completion of Gray Wave 2 has allowed Gray Wave 3 to gain traction. Notably, Wave 3 often represents the most dynamic and extended phase in impulsive sequences, signifying strong bullish momentum.
Following the progression of Gray Wave 3, the next anticipated movement is Gray Wave 4, marking the start of a corrective phase. This development is in line with the cyclical nature of Elliott Wave patterns, which alternate between impulsive and corrective movements.
The invalidation level at 152.327 is critical for assessing the integrity of the current wave count. If prices retrace to or below this level, it may signal a shift in market structure, prompting traders to reassess their strategies.
Summary:
The USDJPY 4-hour chart reveals a bullish trend, with Gray Wave 3 currently unfolding after the completion of Gray Wave 2. This movement reflects robust market momentum, aligning with the impulsive characteristics of Wave 3. Traders are encouraged to keep a close watch on the invalidation level of 152.327 to confirm the wave structure and maintain alignment with the bullish market trajectory.
Technical Analyst: Malik Awais
Source: visit Tradinglounge.com and learn From the Experts Join TradingLounge Here
Previous: Euro/British Pound (EURGBP) Elliott Wave Technical Analysis
VALUE Offer - Buy 1 Month & Get 3 Months!Click here
Access 7 Analysts Over 200 Markets Covered. Chat Room With Support