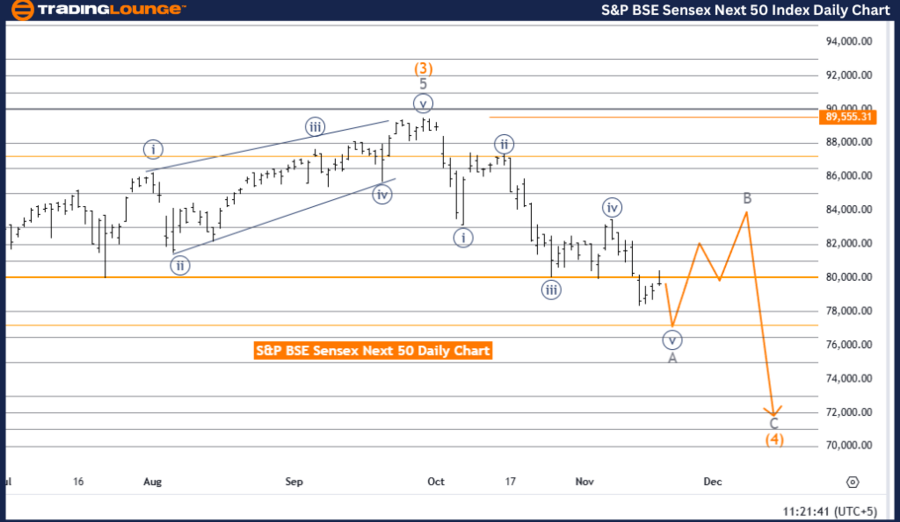
S&P BSE Sensex (India) Elliott Wave Analysis - Trading Lounge Day Chart
S&P BSE Sensex (India) Elliott Wave Technical Analysis
Function: Counter Trend
Mode: Impulsive
Structure: Gray Wave A
Position: Orange Wave 4
Direction (Next Higher Degrees): Gray Wave B
Details: Navy blue wave 4 of A appears completed; navy blue wave 5 of A is now underway.
Wave Cancel Invalidation Level: 89,555.31
The S&P BSE Sensex daily chart analysis, conducted by Trading Lounge, showcases a counter-trend movement within the Elliott Wave framework. The present wave structure is classified as impulsive, focusing on gray wave A and its sub-components.
The analysis reveals that navy blue wave 4 of gray wave A has likely concluded, creating conditions for the development of navy blue wave 5 of A. This advancement signifies the final phase of gray wave A, as wave 5 typically concludes the impulsive wave sequence.
Following the completion of wave A, the market is expected to transition into gray wave B, adhering to the Elliott Wave principle, which alternates between corrective and impulsive phases.
A crucial invalidation level is established at 89,555.31. If the price surpasses this point, the current wave count would be invalidated. This serves as a vital reference for understanding market dynamics and managing trading risks effectively.
Summary:
The S&P BSE Sensex daily chart reflects a counter-trend movement with navy blue wave 5 of gray wave A actively unfolding. This phase represents the last segment of the current impulsive wave and sets the stage for the anticipated corrective gray wave B. Traders should monitor the invalidation level at 89,555.31 closely to ensure the wave count remains accurate and to adapt their strategies based on potential market shifts.
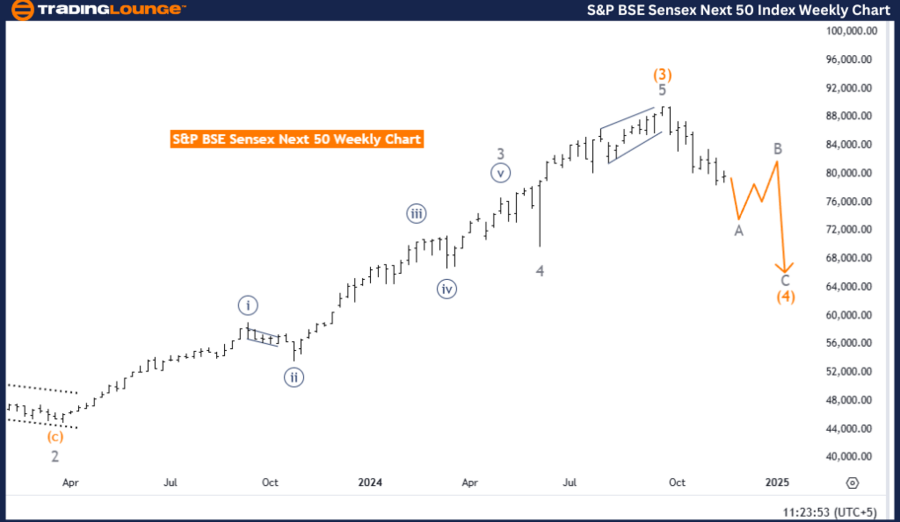
S&P BSE Sensex (India) Elliott Wave Analysis - Trading Lounge Weekly Chart
S&P BSE Sensex (India) Elliott Wave Technical Analysis
Function: Counter Trend
Mode: Impulsive
Structure: Gray Wave A
Position: Orange Wave 4
Direction (Next Higher Degrees): Gray Wave B
Details: Navy blue wave 4 of A appears completed; navy blue wave 5 of A is now unfolding.
Wave Cancel Invalidation Level: 89,555.31
The weekly analysis of the S&P BSE Sensex highlights a counter-trend phase within the Elliott Wave framework. The identified wave structure is impulsive, emphasizing the ongoing progression of gray wave A and its sub-waves.
Gray wave A incorporates smaller waves, with navy blue wave 4 appearing to have finalized. The market is currently advancing through navy blue wave 5 of gray wave A. This wave signifies the conclusion of the current impulsive sequence. Once navy blue wave 5 completes, the market is expected to enter a corrective phase, identified as gray wave B, aligning with the overarching Elliott Wave principles.
An invalidation level at 89,555.31 is defined. Surpassing this threshold would nullify the current wave count, requiring a reassessment of the wave structure and market outlook. This critical level aids traders in validating their analysis and aligning strategies with evolving market conditions.
Summary:
The S&P BSE Sensex weekly chart suggests that the market is approaching the conclusion of impulsive gray wave A, with navy blue wave 5 actively developing. Following this, the market is anticipated to move into the corrective phase of gray wave B. Traders should carefully watch the invalidation level at 89,555.31 to confirm the wave count and adapt their trading approaches to potential deviations in market behavior.
Technical Analyst: Malik Awais
Source: visit Tradinglounge.com and learn From the Experts Join TradingLounge Here
Previous: Shanghai Composite Elliott Wave Technical Analysis
VALUE Offer - Buy 1 Month & Get 3 Months!Click here
Access 7 Analysts Over 200 Markets Covered. Chat Room With Support