23Nov

CIPLA Indian Stocks Elliott Wave Technical Analysis with Daily and 4H Chart Insights: Explore Price Movement Predictions

TradingLounge 1D Chart – CIPLA Elliott Wave Technical Analysis

CIPLA India Day Chart Analysis

CIPLA Elliott Wave Technical Analysis

Function: Counter Trend (Minor Degree Grey)

Mode: Corrective

Structure: Impulse within larger degree Corrective Structure

Position: Minor Wave 1 Grey

Details:

  • A larger degree correction appears underway, with Minor Wave 1 completing around the 1400 mark.

  • Minor Wave 2 concluded near the 1620-1630 range, paving the way for Minor Wave 3.

Invalidation point: 1705

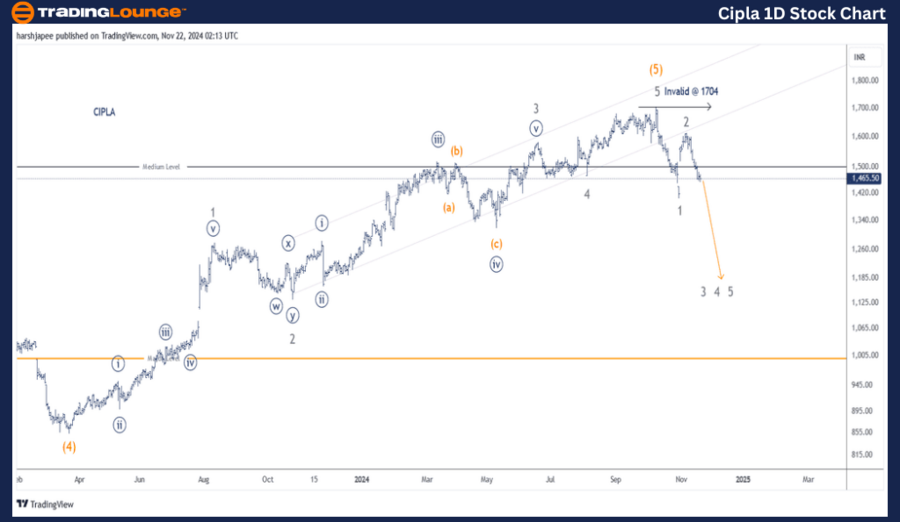
CIPLA Daily Chart Technical Analysis and Potential Elliott Wave Counts:

  • CIPLA’s daily chart suggests a potential end to its larger degree uptrend near the 1705 mark, as prices reversed lower after breaking below 1470, the previous Wave 4 of a lesser degree.

  • Wave 2 rally peaked at 1615, indicating completion, as bearish momentum drags prices lower.

  • Earlier, the stock ended Intermediate Wave (4) near 850 in March 2023. A subsequent impulse rally through 1705 marked a completed trend, transferring control to the bears.

  • Alternatively, the recent dip to 1400 could indicate Minor Wave 4, with bulls possibly working toward a Wave 5 rally.

CIPLA-1D-Stock-Chart...


CIPLA – CIPLA (4H Chart) Elliott Wave Technical Analysis

Function: Counter Trend (Minor Degree Grey)

Mode: Corrective

Structure: Impulse within larger degree Corrective Structure

Position: Minor Wave 1 Grey

Details:

  • A larger degree correction may be progressing, as Minor Wave 1 ended near 1400.

  • Minor Wave 2 rallied toward 1620-1630, setting the stage for Minor Wave 3.

Invalidation point: 1705

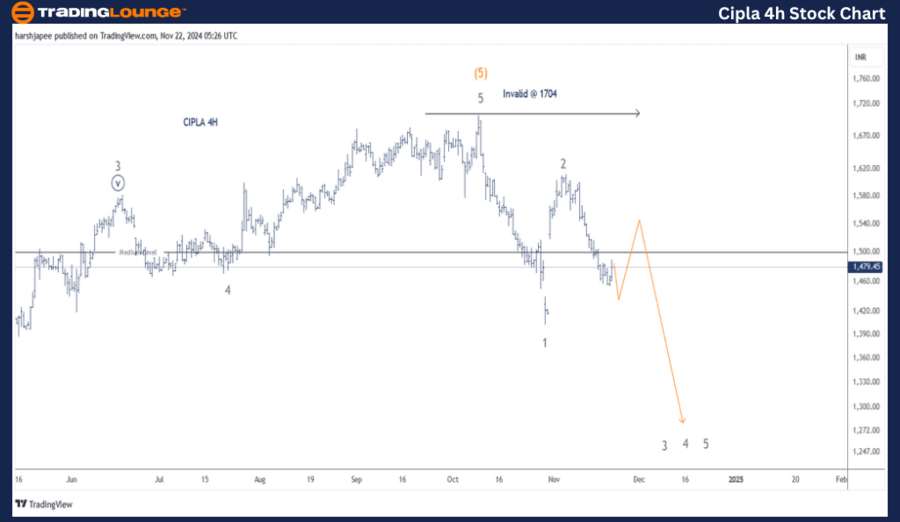
CIPLA 4H Chart Technical Analysis and Potential Elliott Wave Counts:

  • The 4H chart highlights key wave counts since Minor Wave 4 ended near 1470 in August 2024.
  • Minor Wave 5, appearing complete at 1704, preceded a sharp reversal below 1470.
  • Minor Wave 1 ended at 1400, followed by a Wave 2 rally to 1615. The ongoing Minor Wave 3 targets a potential drop toward 1250 or lower.

Technical Analyst: Harsh Japee

Source: visit Tradinglounge.com and learn From the Experts Join TradingLounge Here 

Previous: SUN PHARMACEUTICALS Elliott Wave Technical Analysis

VALUE Offer - Buy 1 Month & Get 3 Months!Click here

Access 7 Analysts Over 200 Markets Covered. Chat Room With Support

CIPLA-4h-Stock-Chart...


Conclusion:

CIPLA is moving downward within Minor Wave 3, with the 1705 level acting as a significant invalidation point for bearish scenarios.

Related

Euro/British Pound(EURGBP) 4 Hour Chart Elliott Wave Technical Analysis 15 November 23

Euro/British Pound(EURGBP) 4 Hour Chart Elliott Wave Technical Analysis 15 November 23

Euro/British Pound(EURGBP) 4 Hour Chart Elliott Wave Technical Analysis 15 November 23 offers an in-...

Read More >
Binance Crypto Price News Today Elliott Wave Technical Analysis: Mastering BNBUSD Trading Dynamics

Binance Crypto Price News Today Elliott Wave Technical Analysis: Mastering BNBUSD Trading Dynamics

This article provides a comprehensive Elliott Wave analysis of the Binance/US Dollar (BNBUSD) tradin...

Read More >
Discover the best FTSE 100 stocks to buy: FTSE 100 (UK) Index Elliott Wave Technical Analysis and Trading

Discover the best FTSE 100 stocks to buy: FTSE 100 (UK) Index Elliott Wave Technical Analysis and Trading

Dive into our detailed FTSE 100 trading and UKX analysis to gain a comprehensive understanding of ma...

Read More >
Commodities & Futures Market Analysis: Elliott Wave Insights & Strategies

Commodities & Futures Market Analysis: Elliott Wave Insights & Strategies

The Commodities Market Trading Report provides a technical analysis using Elliott Wave, trading leve...

Read More >
Elliott Wave Technical Analysis for AbbVie Stock: Forecast, Price Prediction, and Trading Opportunities

Elliott Wave Technical Analysis for AbbVie Stock: Forecast, Price Prediction, and Trading Opportunities

This detailed AbbVie stock analysis applies Elliott Wave theory to assess the stock's current pr...

Read More >
Expert Elliott Wave Technical Analysis for ASX: REA GROUP LTD – Accurate Stock Forecasts and Winning Trading Strategies

Expert Elliott Wave Technical Analysis for ASX: REA GROUP LTD – Accurate Stock Forecasts and Winning Trading Strategies

Explore the comprehensive Elliott Wave analysis for ASX: REA GROUP LTD. This article provides an in-...

Read More >

Buy 1 Month

Get 3 Months!

Special Offer:

Trade Recommendations

Unleash the power of deversified trading with our comprehensive portfolio, covering:

  • Stock Trades
  • Crypto Trades
  • Forex Trades
  • Commodity Trades
Elliott Wave Analysis

Gain a competive edge with expert insights in to:

  • Global Indices
  • US Stocks & ASX Stocks
  • Forex & Crypto
  • Commodities
Top-Notch Trading Tools

Equip yourself with the tools of success:

  • Social Chat
  • Elliott Wave Algorithm
  • Screener
  • TradingLevels
  • Trading Game
7 Elliott Wave Analysts

Stay ahead of the market with daily charts and insightful videos
-Your secret to strategic trading!

JOIN HERE


Welcome to TradingLounge (ASIC A.R.No. 321187), specialists in trades, trading education and technical analysis, covering stocks, indices, commodities, forex and cryptocurrencies.

When you join TradingLounge you have access to everything we offer, including trade tools, educational content and a social platform to chat with like-minded investors.

Read more

@Copyright 2024 by tradinglounge.com

Contact Us

Australian no: 02 4787 6020

International no: +61 (2) 47876020

Pay with:

Find us on