03Dec

HDFC Bank Stock Analysis: Elliott Wave, Daily and 4H Chart Insights, Key Resistance Levels, and Future Predictions

HDFC BANK – HDFCBANK (1D Chart) Elliott Wave Technical Analysis

HDFCBANK Elliott Wave Technical Analysis

Function: Larger Degree Trend Higher (Intermediate Degree, Orange)

Mode: Motive

Structure: Impulse

Position: Minute Wave ((iv)) Navy Flat

Details: Minute Wave ((v)) Navy is advancing within Minor Wave 3 Grey of Intermediate Wave (5) Orange against 1426. No change in invalidation point.

Invalidation Point: 1426

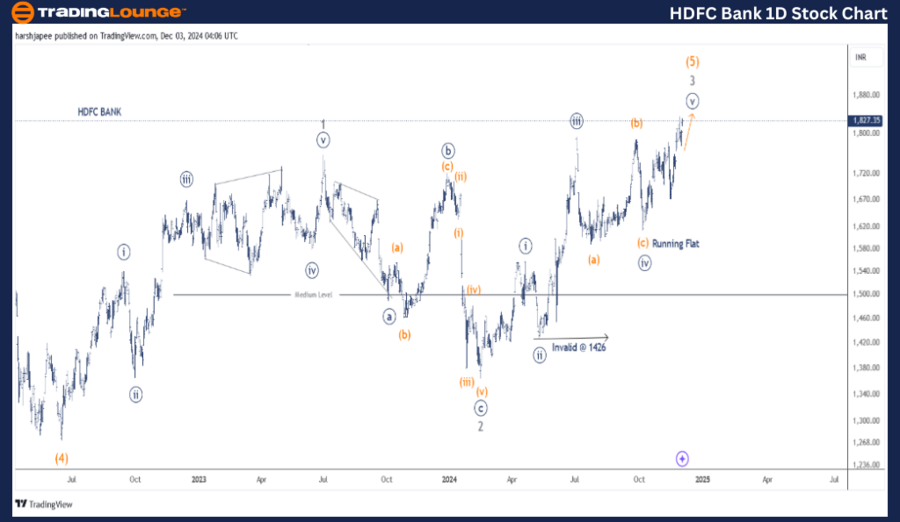
HDFC BANK Daily Chart Technical Analysis and Potential Elliott Wave Counts

The daily chart for HDFC BANK signals a continued rally within Minor Wave 3 Grey of Intermediate Wave (5) Orange against the critical 1426 level. The stock has surpassed the 1800 mark, clearing immediate resistance near 1795, which could trigger further acceleration.

In June 2022, the stock declined to 1275, marking the completion of Intermediate Wave (4). The wave structure since then appears overlapping, with likely counts showing Minor Waves 1 and 2 completed at approximately 1750 and 1365 levels, respectively.

Following this, Minor Wave 3 has been unfolding and shows signs of extension. An alternate count suggests that Minute Wave ((i)) of Minor Wave 3 may be developing against the invalidation level of 1426.

HDFC-BANK-1d-stock-c...


HDFC BANK – HDFCBANK (4H Chart) Elliott Wave Technical Analysis

HDFCBANK Elliott Wave Technical Analysis

Function: Larger Degree Trend Higher (Intermediate Degree, Orange)

Mode: Motive

Structure: Impulse

Position: Minute Wave ((iv)) Navy Flat

Details: Minute Wave ((v)) Navy is advancing within Minor Wave 3 Grey of Intermediate Wave (5) Orange against 1426. Aggressive traders may consider tightening their risk to the 1600-1610 range.

Invalidation Point: 1426

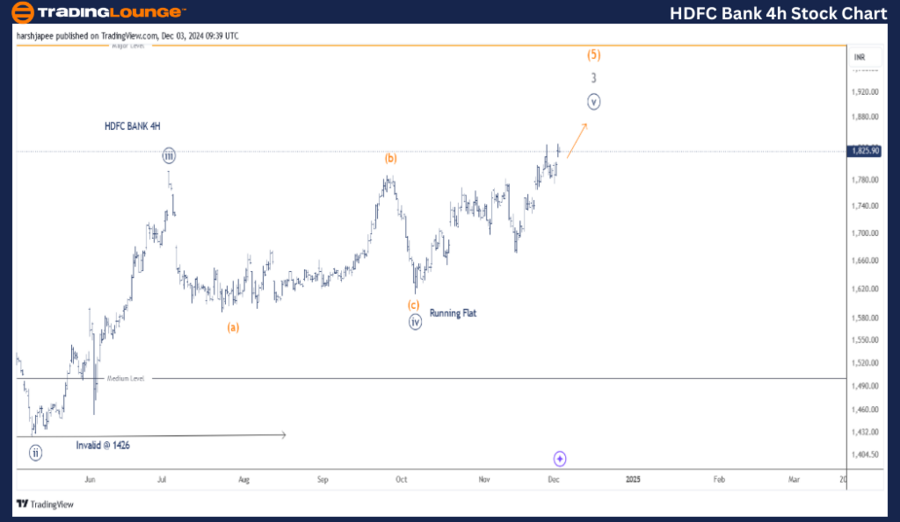
HDFC BANK 4H Chart Technical Analysis and Potential Elliott Wave Counts

The 4H chart for HDFC BANK outlines sub-waves from Minute Wave ((iii)), which culminated near 1495 in July 2024. Minute Wave ((iv)) followed as a running flat and concluded near the 1610 level. If this structure holds, Minute Wave ((v)) may currently be unfolding and could form either an impulse or a diagonal pattern.

Technical Analyst: Harsh Japee

Source: visit Tradinglounge.com and learn From the Experts Join TradingLounge Here 

Previous: BAJAJAUTO Elliott Wave Technical Analysis 

VALUE Offer - Buy 1 Month & Get 3 Months!Click here

Access 7 Analysts Over 200 Markets Covered. Chat Room With Support

HDFC-BANK-4h-stock-c...


Conclusion

HDFC BANK is advancing within Minute Wave ((v)) Navy of Minor Wave 3 Grey under Intermediate Wave (5) Orange against the invalidation point of 1426.

Related

Unlocking ASX Trading Success: REECE LIMITED – REH Stock Analysis & Elliott Wave Technical Forecast

Unlocking ASX Trading Success: REECE LIMITED – REH Stock Analysis & Elliott Wave Technical Forecast

This article provides a detailed Elliott Wave analysis of ASX: Reece Limited (REH), exploring potent...

Read More >
DIS Elliott Wave Analysis: Identifying Trading Opportunities for The Walt Disney Company (DIS)

DIS Elliott Wave Analysis: Identifying Trading Opportunities for The Walt Disney Company (DIS)

DIS Elliott Wave Analysis for The Walt Disney Company (DIS), reveals potential for both bullish and ...

Read More >
Meta Platforms Inc.(META:NASDAQ) Elliott Wave Technical Analysis 30 November 23

Meta Platforms Inc.(META:NASDAQ) Elliott Wave Technical Analysis 30 November 23

Meta Platforms Inc.(META: NASDAQ) Elliott Wave Technical Analysis dated 30 November 23. META Stock M...

Read More >
Euro/ U.S. Dollar (EURUSD) Forex Elliott Wave Technical Analysis:  Detailed insights into the current market trends

Euro/ U.S. Dollar (EURUSD) Forex Elliott Wave Technical Analysis: Detailed insights into the current market trends

This article provides a comprehensive Elliott Wave Analysis of the EURUSD pair, covering both day an...

Read More >
Advanced Micro Devices Inc. (AMD) Elliott Wave Technical Analysis Provides Traders with Valuable insights into AMD's price movements

Advanced Micro Devices Inc. (AMD) Elliott Wave Technical Analysis Provides Traders with Valuable insights into AMD's price movements

Our detailed Elliott Wave analysis for Advanced Micro Devices Inc. (AMD) provides traders with valua...

Read More >
What is Bitcoin Hash Rate ?

What is Bitcoin Hash Rate ?

The Bitcoin hash rate measures the total computational power used by miners to process transactions ...

Read More >

Buy 1 Month

Get 3 Months!

Special Offer:

Trade Recommendations

Unleash the power of deversified trading with our comprehensive portfolio, covering:

  • Stock Trades
  • Crypto Trades
  • Forex Trades
  • Commodity Trades
Elliott Wave Analysis

Gain a competive edge with expert insights in to:

  • Global Indices
  • US Stocks & ASX Stocks
  • Forex & Crypto
  • Commodities
Top-Notch Trading Tools

Equip yourself with the tools of success:

  • Social Chat
  • Elliott Wave Algorithm
  • Screener
  • TradingLevels
  • Trading Game
7 Elliott Wave Analysts

Stay ahead of the market with daily charts and insightful videos
-Your secret to strategic trading!

JOIN HERE


Welcome to TradingLounge (ASIC A.R.No. 321187), specialists in trades, trading education and technical analysis, covering stocks, indices, commodities, forex and cryptocurrencies.

When you join TradingLounge you have access to everything we offer, including trade tools, educational content and a social platform to chat with like-minded investors.

Read more

@Copyright 2024 by tradinglounge.com

Contact Us

Australian no: 02 4787 6020

International no: +61 (2) 47876020

Pay with:

Find us on