20Dec

Texas Instruments Inc.(TXN:NYSE) Elliott Wave Technical Analysis 20 December 23

Texas Instruments Inc., Elliott Wave Technical Analysis

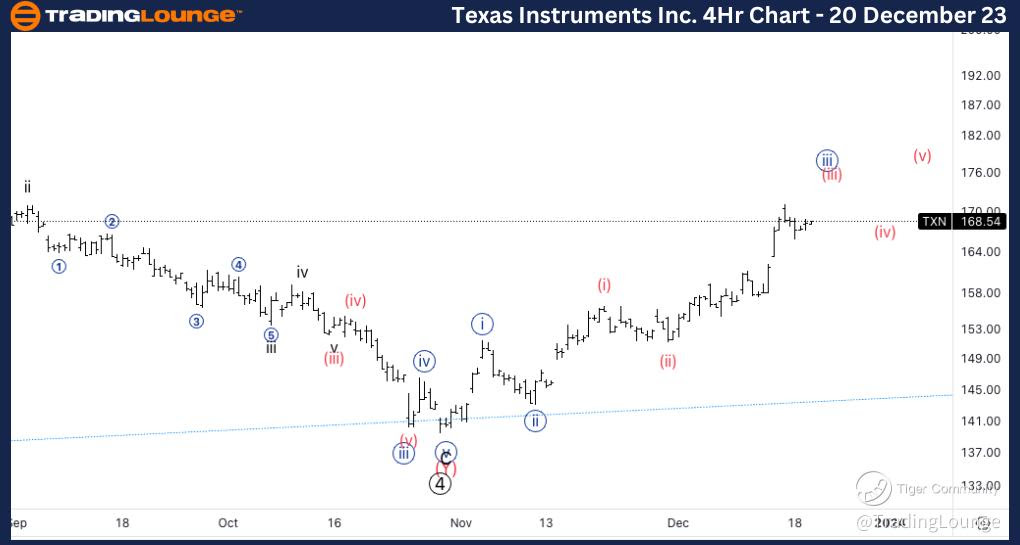
Texas Instruments Inc., (TXN:NYSE): 4h Chart 20 December 23

TXN Stock Market Analysis: We have been looking for continuation higher and we kept correcting sideways, signifying the trend is still to the upside. Looking for continuation higher into a complete five wave sequence.  

TXN Elliott Wave Count: Wave (iii) of {iii}.  

TXN Technical Indicators: Above all averages.

TXN Trading Strategy: Looking for longs into wave {iii}.

TradingLounge Analyst: Alessio Barretta

Source: Tradinglounge.com get trial here!
TXN-4Hr-Stock-Chart-...


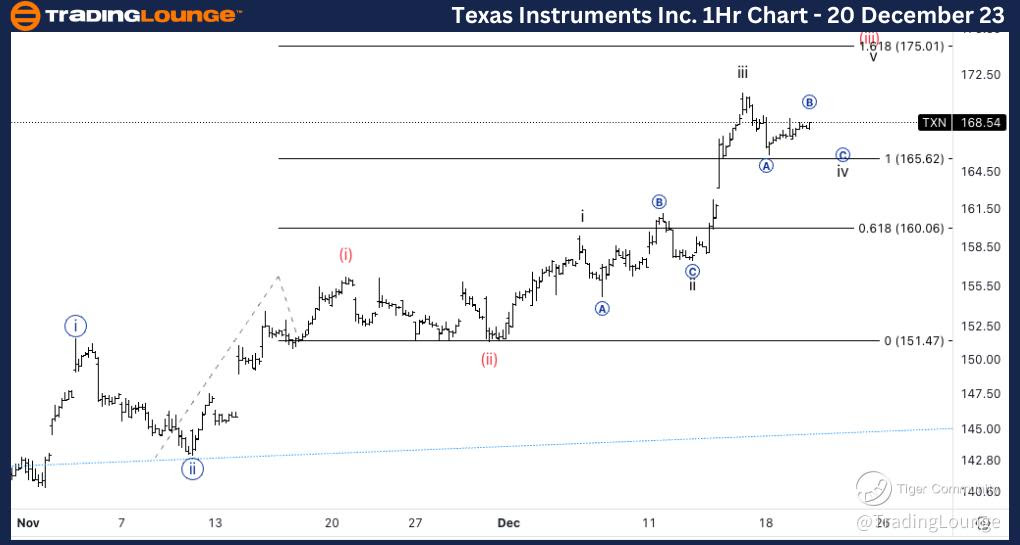
Texas Instruments Inc., TXN: 1-hour Chart 20 December 23

Texas Instruments Inc., Elliott Wave Technical Analysis 

TXN Stock Market Analysis: Looking for a pullback in wave iv, as I see a potential five wave move off the wave iii top we could be in wave B of iv, therefore expecting further downside.  

TXN Elliott Wave count:  Wave B of iv.  

TXN Technical Indicators: Above all averages.

TXN Trading Strategy: Looking for longs into wave v towards 1.618 {iii} vs. {i}.
TXN-1Hr-Stock-Chart-...

Related

Australian Dollar / Japanese Yen(AUDJPY) Elliott Wave Technical Analysis 24 November 23

Australian Dollar / Japanese Yen(AUDJPY) Elliott Wave Technical Analysis 24 November 23

The AUDJPY Elliott Wave Analysis Trading Lounge Day Chart dated 24 November 23, provides a comprehen...

Read More >
Detailed Analysis Covers Cocoa Commodity Elliott Wave Technical Analysis

Detailed Analysis Covers Cocoa Commodity Elliott Wave Technical Analysis

Discover the intricacies of Elliott Wave Analysis applied to cocoa trading. This detailed analysis c...

Read More >
Cardano/U.S. dollar(ADAUSD) Elliott Wave Technical Analysis 9 January 24

Cardano/U.S. dollar(ADAUSD) Elliott Wave Technical Analysis 9 January 24

Cardano and U.S. dollar Elliott Wave Technical Analysis dated 9 January 24, ADAUSD Trading Strategy ...

Read More >
Identified support levels and predicted price targets Analog Devices Inc. Stock: ADI Elliott Wave Technical Analysis

Identified support levels and predicted price targets Analog Devices Inc. Stock: ADI Elliott Wave Technical Analysis

This comprehensive Elliott Wave analysis of Analog Devices Inc. (ADI) for June 2024 offers a deep di...

Read More >
Natural Gas (NG) Trends: Navigating Elliott Wave Technical Analysis for Profitable Insights

Natural Gas (NG) Trends: Navigating Elliott Wave Technical Analysis for Profitable Insights

NG's Elliott wave analysis points to continued downside potential. Despite a recent bounce, the ...

Read More >

Buy 1 Month

Get 3 Months!

Special Offer:

Trade Recommendations

Unleash the power of deversified trading with our comprehensive portfolio, covering:

  • Stock Trades
  • Crypto Trades
  • Forex Trades
  • Commodity Trades
Elliott Wave Analysis

Gain a competive edge with expert insights in to:

  • Global Indices
  • US Stocks & ASX Stocks
  • Forex & Crypto
  • Commodities
Top-Notch Trading Tools

Equip yourself with the tools of success:

  • Social Chat
  • Elliott Wave Algorithm
  • Screener
  • TradingLevels
  • Trading Game
7 Elliott Wave Analysts

Stay ahead of the market with daily charts and insightful videos
-Your secret to strategic trading!

JOIN HERE


Welcome to TradingLounge (ASIC A.R.No. 321187), specialists in trades, trading education and technical analysis, covering stocks, indices, commodities, forex and cryptocurrencies.

When you join TradingLounge you have access to everything we offer, including trade tools, educational content and a social platform to chat with like-minded investors.

Read more

@Copyright 2024 by tradinglounge.com

Contact Us

Australian no: 02 4787 6020

International no: +61 (2) 47876020

Pay with:

Find us on