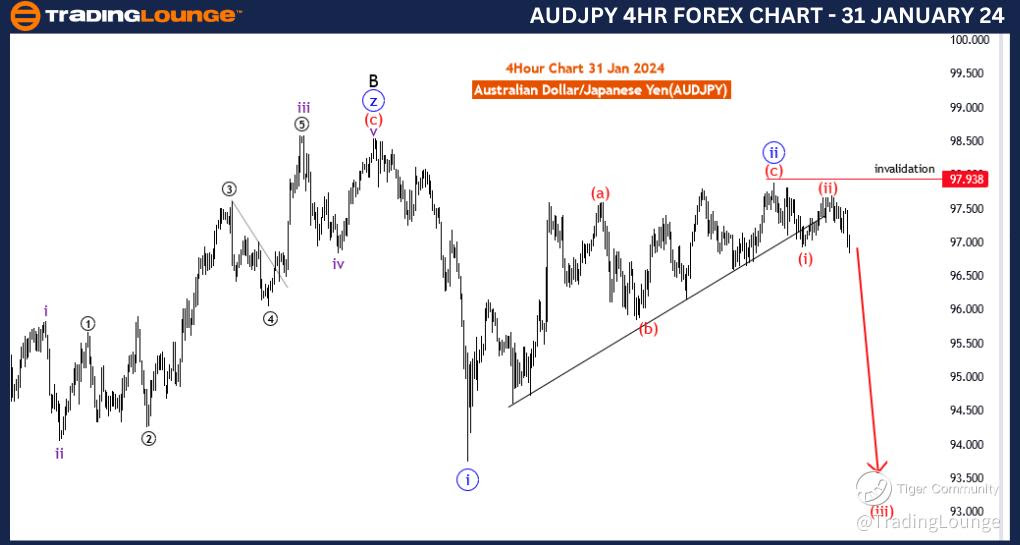
AUDJPY Elliott Wave Analysis Trading Lounge 4 Hour Chart,31 January 24
Australian Dollar/Japanese Yen(AUDJPY) 4 Hour Chart
AUDJPY Elliott Wave Technical Analysis
FUNCTION: Counter Trend
MODE: impulsive
STRUCTURE: red wave 3 of blue wave 3
POSITION: black wave C
DIRECTION NEXT HIGHER DEGREES: red wave 4 of 3
DETAILS: red wave 2 of blue wave 3 looking completed at 97.704 .Now red wave 3 of blue wave 3 is in play . Wave Cancel invalid level: 97.938
The "AUDJPY Elliott Wave Analysis Trading Lounge 4 Hour Chart" dated 31 January 24, offers a comprehensive analysis of the Australian Dollar/Japanese Yen (AUDJPY) currency pair, focusing on the 4-hour chart and utilizing Elliott Wave Technical Analysis.
The identified "FUNCTION" is "Counter Trend," suggesting that the analysis is focused on identifying potential movements against the prevailing trend. This could imply a strategy that considers countertrend opportunities.
The "MODE" is specified as "Impulsive," indicating an expectation of strong, directional price movements. Impulsive waves are often characterized by swift and decisive price action.
The "STRUCTURE" is labeled as "red wave 3 of blue wave 3," outlining the current wave count within the Elliott Wave framework. This suggests a detailed breakdown of the ongoing market movement within a specific degree of wave counts.
The "POSITION" is defined as "black wave C," indicating the current position within the broader wave count. This likely suggests that the current impulsive movement is part of a larger corrective structure.
Regarding "DIRECTION NEXT HIGHER DEGREES," the analysis points to "red wave 4 of 3," implying the expected movement in the next higher degree of wave count. This suggests an anticipation of a corrective wave following the current impulsive movement.
In terms of "DETAILS," it mentions that "red wave 2 of blue wave 3 looking completed at 97.704." This indicates the completion of a corrective wave and the initiation of a new impulsive movement, specifically "red wave 3 of blue wave 3."
The "Wave Cancel invalid level" is specified as "97.938." This serves as a critical reference point, and a breach of this level could potentially invalidate the current wave count, signaling a shift in the anticipated market movements.
In summary, the AUDJPY Elliott Wave Analysis for the 4-hour chart on 31 January 24, suggests an ongoing impulsive movement (red wave 3 of blue wave 3) following the completion of a corrective wave. Traders are advised to closely monitor the market, particularly the invalidation level at 97.938.
Technical Analyst: Malik Awais
Source: Tradinglounge.com, Learn From the Experts Join TradingLounge Here
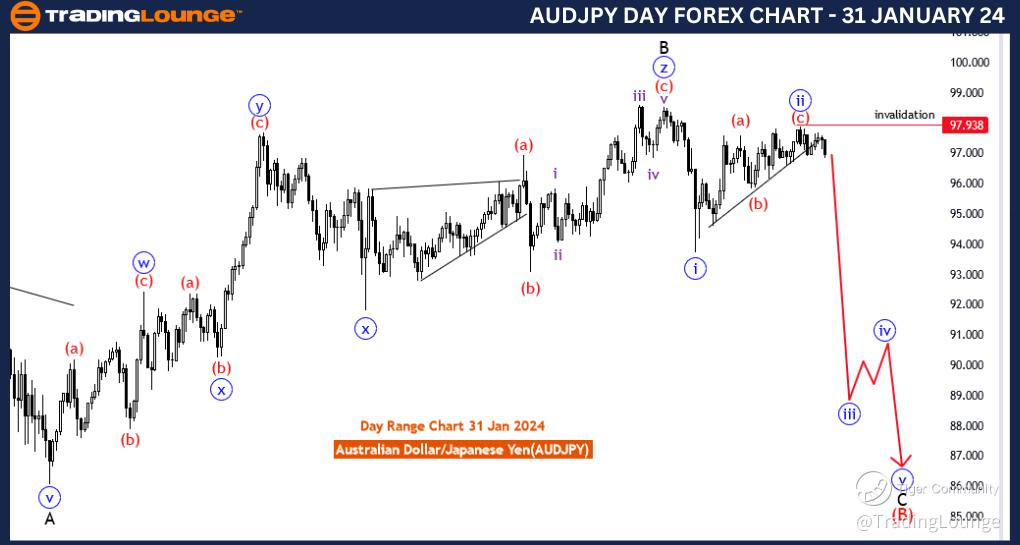
AUDJPY Elliott Wave Analysis Trading Lounge Day Chart,31 January 24
Australian Dollar / Japanese Yen(AUDJPY) Day Chart
AUDJPY Elliott Wave Technical Analysis
FUNCTION: Counter Trend
MODE: impulsive
STRUCTURE: Blue wave 3 of C
POSITION: Red wave B
DIRECTION NEXT HIGHER DEGREES: blue wave 4 of C
DETAILS: Blue Wave 2 looking completed .Now blue wave 3 of wave C is in play . Wave Cancel invalid level: 97.938
The "AUDJPY Elliott Wave Analysis Trading Lounge Day Chart" dated 31 January 24, provides a detailed analysis of the Australian Dollar/Japanese Yen (AUDJPY) currency pair, focusing on the daily chart and employing Elliott Wave Technical Analysis.
The identified "FUNCTION" is "Counter Trend," indicating that the analysis is centered around identifying potential movements against the prevailing trend. This suggests a focus on counter trend trading opportunities.
The "MODE" is specified as "Impulsive," signaling an expectation of strong, directional price movements. Impulsive waves often indicate a decisive and rapid price action in the direction of the prevailing trend.
The "STRUCTURE" is labeled as "Blue wave 3 of C," outlining the current wave count within the Elliott Wave framework. This indicates that the analysis is zooming into a specific degree of wave counts within the corrective structure labeled as "C."
The "POSITION" is defined as "Red wave B," suggesting the current position within the broader wave count. This likely implies that the impulsive movement identified is part of a larger corrective structure labeled as "B."
Regarding "DIRECTION NEXT HIGHER DEGREES," the analysis points to "blue wave 4 of C," anticipating the movement in the next higher degree of wave count. This suggests an expected correction following the completion of the current impulsive wave.
In terms of "DETAILS," it mentions that "blue wave 2 looking completed." This indicates the completion of a corrective wave (wave 2) and the initiation of a new impulsive movement, specifically "blue wave 3 of wave C."
The "Wave Cancel invalid level" is specified as "97.938." This serves as a crucial reference point, and a breach of this level could potentially invalidate the current wave count, signaling a shift in the anticipated market movements.
In summary, the AUDJPY Elliott Wave Analysis for the daily chart on 31 January 24, suggests an ongoing impulsive movement (blue wave 3 of C) following the completion of a corrective wave (blue wave 2). Traders are advised to closely monitor the market, particularly the invalidation level at 97.938.
Technical Analyst: Malik Awais
Source: Tradinglounge.com, Learn From the Experts Join TradingLounge Here
Previous: British Pound/U.S. Dollar(GBPUSD)