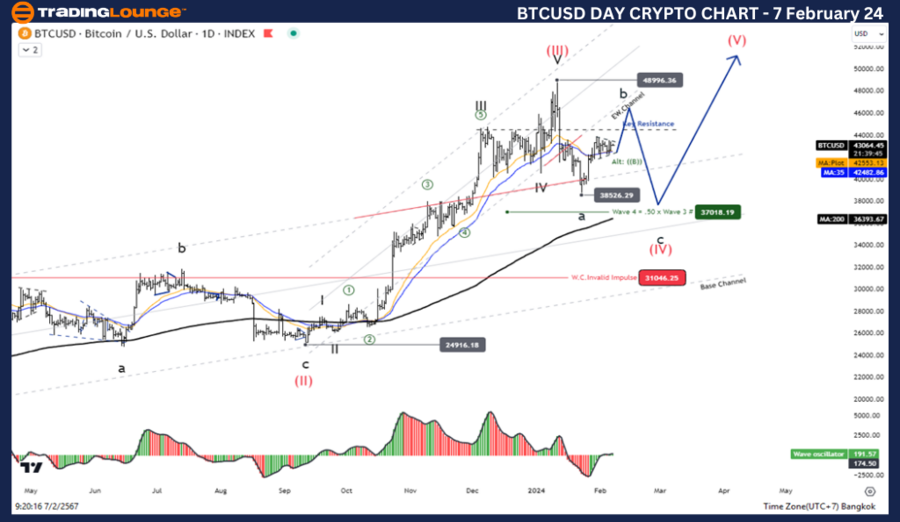
Bitcoin / U.S. dollar(BTCUSD) Elliott Wave Technical Analysis Day Chart
Function: Counter Trend
Mode: Corrective
Structure: Zigzag
Position: Wave B
Direction Next higher Degrees: Wave (IV)
Wave Cancel invalid level: 31046.25
In the realm of BTCUSD Elliott Wave Analysis, the current scenario unveils a counter-trend movement characterized by corrective zigzag patterns. Positioned within Wave B, the market anticipates the next higher degree movement in Wave (IV), with a crucial invalidation level set at 31046.25.
Analyzing the Details:
The ongoing phase witnesses a pullback within Wave B Black, signaling an impending decline in Wave C Black. This corrective movement indicates a potential retest of key resistance levels, particularly around the 44500 mark.
Bitcoin / U.S. dollar(BTCUSD) Trading Strategy:
As the correction unfolds within the zigzag pattern, traders are advised to exercise patience and await the completion of Wave B before considering reentry into the trend during Wave (V). This strategic approach aligns with capitalizing on the anticipated market movements while minimizing risks associated with corrective phases.
Bitcoin / U.S. dollar(BTCUSD) Technical Indicators:
Technical indicators provide valuable insights into market dynamics. Currently, the price trend is positioned above the MA200, indicating an uptrend sentiment. Furthermore, Wave Oscillators exhibit bullish momentum, reinforcing the potential for upward price movements.
TradingLounge Analyst: Kittiampon Somboonsod, CEWA
Technical Analyst: Kittiampon Somboonsod
Source: visit Tradinglounge.com and learn From the Experts Join TradingLounge Here
See Previous: VeChain (VETUSD)
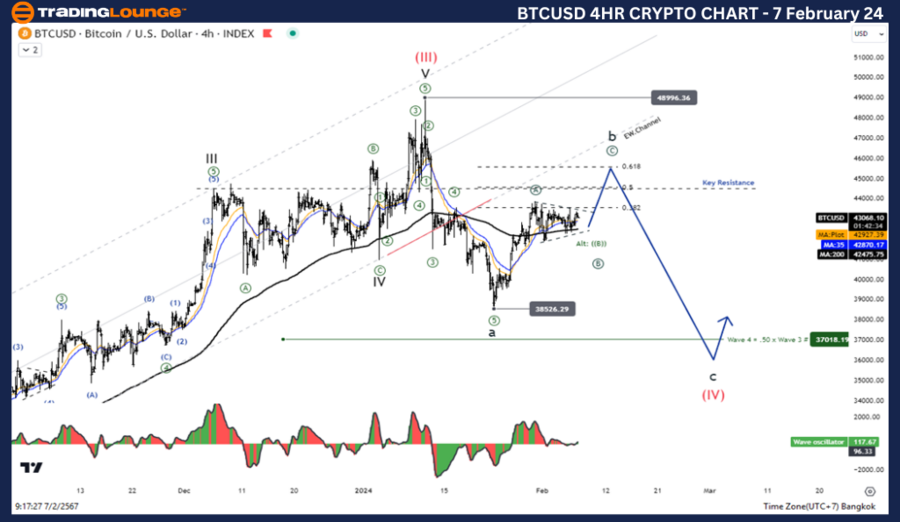
Unveiling BTCUSD Elliott Wave Analysis in 4Hr Chart:
Bitcoin / U.S. dollar(BTCUSD) Elliott Wave Technical Analysis:
Function: Counter Trend
Mode: Corrective
Structure: Zigzag
Position: Wave B
Direction Next higher Degrees: Wave (IV)
Wave Cancel invalid level: 31046.25
Exploring the 4-hour chart, the corrective journey within the zigzag pattern continues, with Wave B Black poised to retest key resistance levels around the 44500 threshold. This phase underscores the importance of closely monitoring price movements and potential breakout scenarios.
Refined Trading Strategy:
Aligned with the overarching analysis, the trading strategy remains focused on navigating the corrective phase with prudence. Waiting for the completion of Wave B before considering reentry during Wave (V) remains a prudent approach to capitalize on market opportunities.
Technical Indicator Insights:
Technical indicators provide nuanced insights into market sentiment. Currently, the price trend remains below the MA200, indicating a prevailing downtrend sentiment. Despite this, Wave Oscillators portray bullish momentum, suggesting potential reversals or corrective movements amidst the broader downtrend.
In Conclusion:
BTCUSD Elliott Wave Analysis offers a comprehensive understanding of market dynamics, emphasizing corrective patterns within the zigzag structure. Trading strategies centered on patience and strategic reentry align with capitalizing on market movements while mitigating risks associated with corrective phases. Stay informed with TradingLounge analyst insights for a well-rounded perspective on BTCUSD trading dynamics.