Natural Gas Elliott Wave Technical Analysis 12 February 24

Welcome to Tradinglounge detailed Natural Gas Elliott Wave Technical Analysis for February 12. In this comprehensive analysis, we will delve into the intricate details of the current market trends, focusing on the 4-hour and daily charts. Our analysis revolves around the Elliott Wave Theory, a powerful tool for understanding market movements.

Elliott Wave Analysis Overview:

Function - Trend

Our analysis identifies the prevailing market trend for Natural Gas, crucial for making informed trading decisions. By understanding the market's primary direction, we can anticipate potential profit opportunities.

Mode - Impulsive

The market is currently exhibiting an impulsive mode, indicating a strong and decisive price movement. This characteristic is essential for traders seeking to capitalize on significant market shifts.

Structure - Impulse Wave

The structure of the market suggests an impulse wave, emphasizing the strong directional movement in play. Traders can use this information to align their strategies with the prevailing market dynamics.

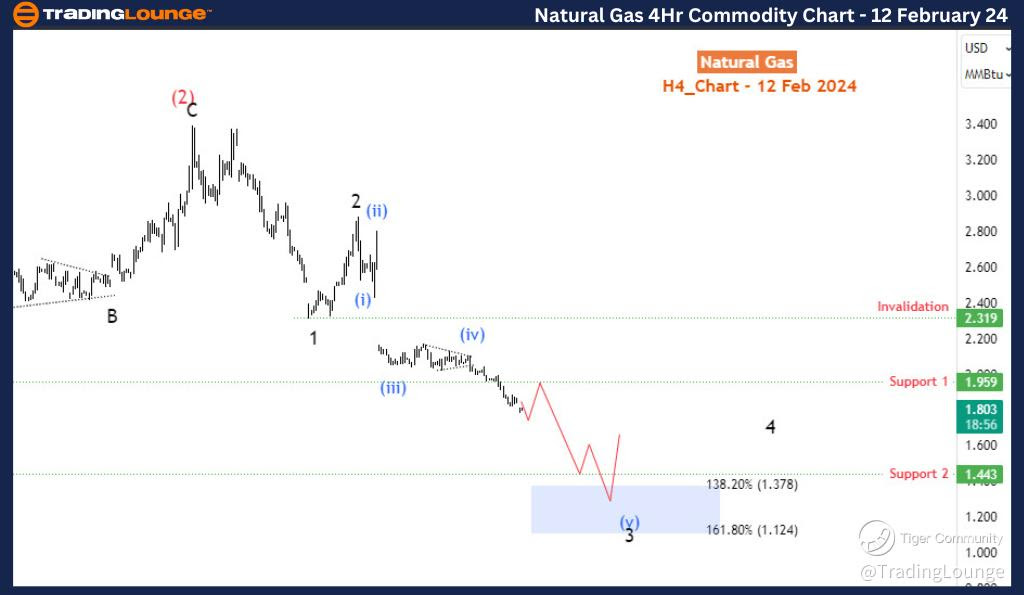
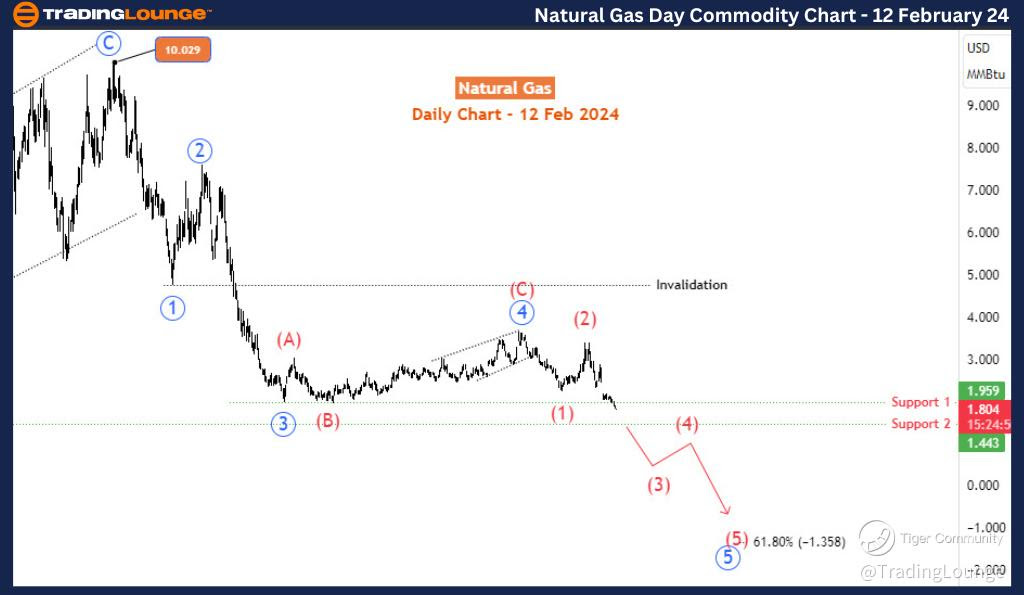
Position - Black Wave 3 of Larger Degree Red Wave (3)

Our analysis pinpoints the current position of Natural Gas within the larger Elliott Wave framework. Specifically, we are observing the development of the Black Wave 3 within the higher-degree Red Wave (3), providing valuable insights into the ongoing market sentiment.

Direction - Black Wave 3 of Higher Degree Red Wave (3) Still in Play

The identified Black Wave 3 within the higher-degree Red Wave (3) is confirmed to be active. Traders should remain attentive to this directional movement, as it continues to influence market dynamics.

Detailed Analysis: Our analysis delves into the finer details of the current wave structure:

Details: Wave (3) evolving into a bearish impulse.

The ongoing evolution of Wave (3) indicates a bearish impulse, signaling a potential downturn in Natural Gas prices. Traders should closely monitor this development for strategic decision-making.

Sub-wave 3 (in Black) broke below 1.959 support and could extend toward 1.378-1.124 key Fib zone.

A critical aspect of our analysis is the identification of sub-wave 3 (in Black), which has breached the crucial 1.959 support level. This breach suggests a potential downward extension towards the 1.378-1.124 key Fibonacci zone, providing traders with specific levels to watch.

Technical Analyst: Sanmi

Source: visit Tradinglounge.com and learn From the Experts Join TradingLounge Here 

Natural Gas, 4Hr Chart:

Natural-Gas-4hr-comm...


Natural Gas, Day Chart:

Natural-Gas-day-comm...


Conclusion: In conclusion, our Natural Gas Elliott Wave Technical Analysis on the 4-hour and daily charts for February 12 provides a comprehensive overview of the market trends. Traders can use this information to make informed decisions, capitalizing on the identified impulsive mode and bearish impulse wave. Stay tuned for further updates as we closely monitor the evolving market dynamics.

Related

Understand how Elliott Wave Theory Applies to DIS Stock's Future Trajectory: The Walt Disney Co. Technical Analysis

Understand how Elliott Wave Theory Applies to DIS Stock's Future Trajectory: The Walt Disney Co. Technical Analysis

Explore an in-depth Elliott Wave analysis of The Walt Disney Co. (DIS), highlighting current price m...

Read More >
The Coca-Cola Company (KO) - Stocks Analysis, Elliott Wave Technical Forecast & Price Prediction

The Coca-Cola Company (KO) - Stocks Analysis, Elliott Wave Technical Forecast & Price Prediction

Dive into the dynamic world of Coca-Cola's (KO) stock with our expert analysis guided by Elliott...

Read More >
Elliott Wave Technical Analysis of Natural Gas Commodity: A Trader's Guide to Market Trends and Predictions

Elliott Wave Technical Analysis of Natural Gas Commodity: A Trader's Guide to Market Trends and Predictions

This article offers a detailed examination of natural gas markets through the lens of Elliott Wave T...

Read More >
Examines NTPC's Recent Price Trends, Support and Resistance Levels: NTPC Stocks Elliott Wave Technical Analysis

Examines NTPC's Recent Price Trends, Support and Resistance Levels: NTPC Stocks Elliott Wave Technical Analysis

This article provides a comprehensive Elliott Wave analysis of NTPC stock, highlighting key price ta...

Read More >
Polkadot Crypto Price News Today Elliott Wave Technical Analysis: Price Trends, Key Levels, and Trading Insights

Polkadot Crypto Price News Today Elliott Wave Technical Analysis: Price Trends, Key Levels, and Trading Insights

Get a comprehensive DOT/USD Elliott Wave analysis, including technical insights and price forecasts....

Read More >
Unlocking ASX Trading Success: WOODSIDE ENERGY GROUP LTD - WDS Stock Analysis & Elliott Wave Technical Forecast

Unlocking ASX Trading Success: WOODSIDE ENERGY GROUP LTD - WDS Stock Analysis & Elliott Wave Technical Forecast

This article provides a detailed Elliott Wave technical analysis of ASX Woodside Energy Group Ltd (W...

Read More >

Buy 1 Month

Get 3 Months!

Special Offer:

Trade Recommendations

Unleash the power of deversified trading with our comprehensive portfolio, covering:

  • Stock Trades
  • Crypto Trades
  • Forex Trades
  • Commodity Trades
Elliott Wave Analysis

Gain a competive edge with expert insights in to:

  • Global Indices
  • US Stocks & ASX Stocks
  • Forex & Crypto
  • Commodities
Top-Notch Trading Tools

Equip yourself with the tools of success:

  • Social Chat
  • Elliott Wave Algorithm
  • Screener
  • TradingLevels
  • Trading Game
7 Elliott Wave Analysts

Stay ahead of the market with daily charts and insightful videos
-Your secret to strategic trading!

JOIN HERE


Welcome to TradingLounge (ASIC A.R.No. 321187), specialists in trades, trading education and technical analysis, covering stocks, indices, commodities, forex and cryptocurrencies.

When you join TradingLounge you have access to everything we offer, including trade tools, educational content and a social platform to chat with like-minded investors.

Read more

@Copyright 2024 by tradinglounge.com

Contact Us

Australian no: 02 4787 6020

International no: +61 (2) 47876020

Pay with:

Find us on