15Feb

WTI Crude Oil Commodity Elliott Wave Analysis: Bullish Correction Poised to Advance Further

WTI: bullish correction could advance further

In the realm of Elliott Wave Analysis, the latest insights on WTI Crude Oil indicate a potential bullish correction gaining momentum. This analysis, conducted on February 15, 2024, unveils crucial details for traders seeking to navigate the dynamic energy markets.

WTI Crude Oil Elliott Wave Analysis

Function - Counter-trend

Mode - Corrective

Structure - Zigzag

Position - Black wave X of higher degree red wave (B). Blue sub-wave a of Y is complete

Direction - Black wave Y of higher degree red wave (B). Blue sub-wave b of Y is in progress

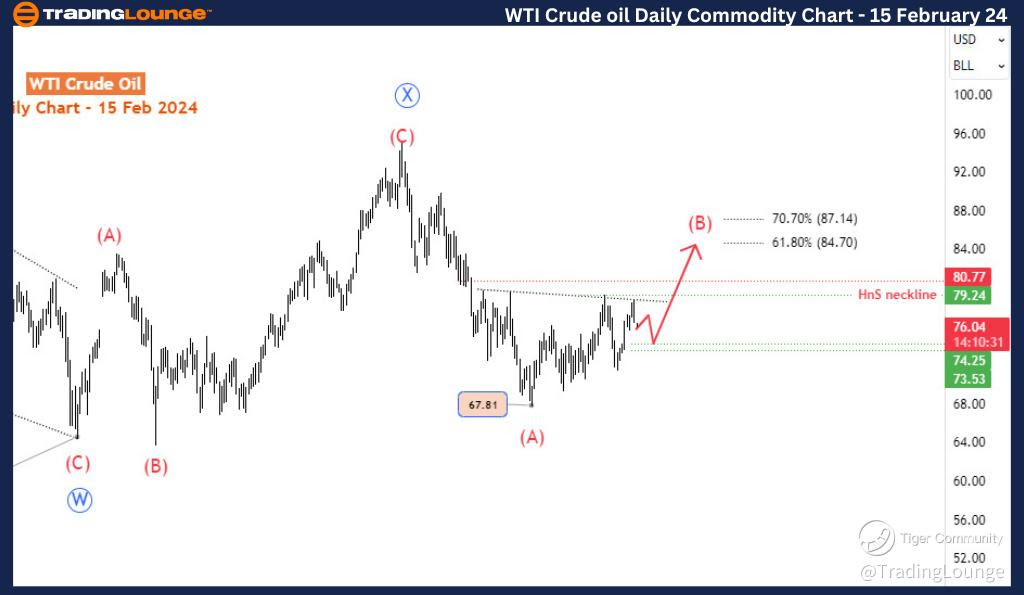
On the daily timeframe, WTI oil has completed a bearish impulse wave labeled as red wave (A), with wave (B) currently underway. These waves are part of a larger degree correction, responding to the completion of blue wave X (circled) at 94.5 in September 2023. The anticipated red wave (C) is expected to take the commodity lower than previous lows at 67.8 and 64.5. Confirmation of completion for red wave (B) is crucial before further analysis.

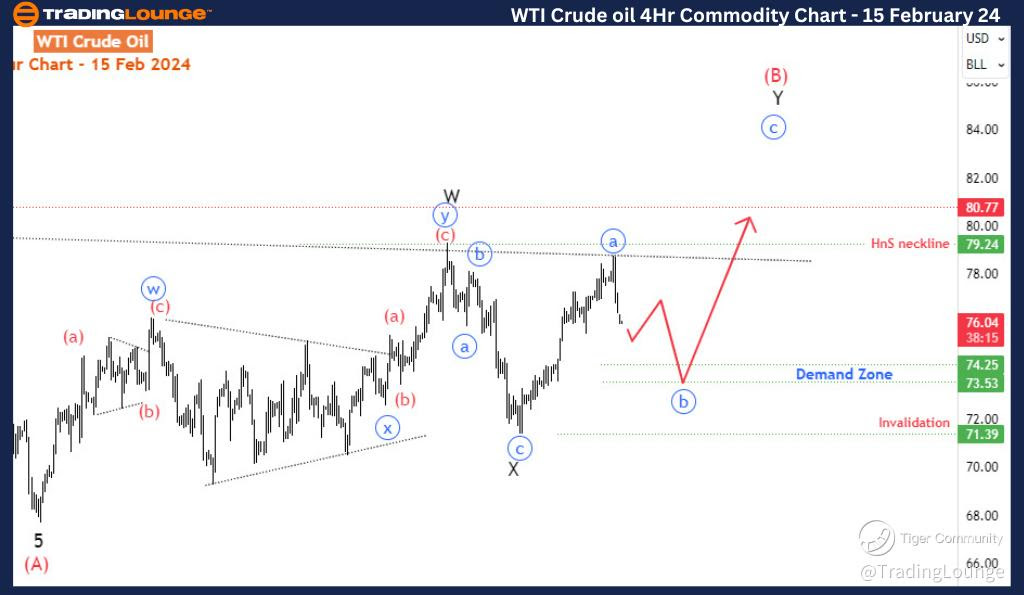
Zooming in on the 4-hour timeframe, a double zigzag pattern from 67.81 indicates red wave (B) development. Sub-wave W-X concluded at 71.39, followed by a bullish move towards 79. The current surge likely represents the blue sub-wave ‘a’ of black wave Y within red wave (B). However, validation requires the completion of corrective blue wave b, potentially finding support in the 74.25-75.53 demand zone.

For a bullish trade setup, it's essential to monitor the validity of this corrective pattern, with a break below 71.39 signaling invalidation. If the bullish correction holds, further upward movement towards 84 for WTI crude can be expected.

WTI Crude Oil Day Chart -
WTI-Crude-oil-day-co...


In summary, WTI price action suggests a bullish corrective phase in a larger bearish corrective cycle is in progress for WTI oil, with red wave (B) completing the bullish corrective phase. Confirmation of the completion of red wave (B) is crucial for determining the next long-term directional bias. However, swing and short-term traders can look for trading opportunities in the direction of wave (B) until it completes. Also, traders should closely monitor price action and key support levels on both the daily and 4-hour timeframes to capitalize on potential trading opportunities while managing risk effectively.

Technical Analyst : Sanmi Adeagbo

Source: visit Tradinglounge.com and learn From the Experts Join TradingLounge Here 

See Previous: Gold (XAUUSD)
WTI-Crude-oil-4hr-co...

Related

Dogecoin Elliott Wave Technical Analysis: Price Predictions, Trading Strategies, and Market Trends

Dogecoin Elliott Wave Technical Analysis: Price Predictions, Trading Strategies, and Market Trends

Get comprehensive insights into Dogecoin's (DOGEUSD) market trends using Elliott Wave analysis. ...

Read More >
Euro/U.S.Dollar(EURUSD) Day Chart Elliott Wave Technical Analysis 10 November 23

Euro/U.S.Dollar(EURUSD) Day Chart Elliott Wave Technical Analysis 10 November 23

Euro/U.S.Dollar(EURUSD) Day Chart Elliott Wave Technical Analysis 10 November 23 suggests a Counter ...

Read More >
"Comprehensive Commodity Market Elliott Wave Analysis: Bitcoin, ETH/USD, Gold, Silver, and More"

"Comprehensive Commodity Market Elliott Wave Analysis: Bitcoin, ETH/USD, Gold, Silver, and More"

Commodity Market Elliott Wave Analysis Summary - Bitcoin (BTC) and ETH/USD: Tracking Wave v) of 1 o...

Read More >
Bitcoin/U.S. dollar(BTCUSD) Elliott Wave Technical Analysis 1 November 23

Bitcoin/U.S. dollar(BTCUSD) Elliott Wave Technical Analysis 1 November 23

Bitcoin/U.S. dollar(BTCUSD) Elliott Wave Technical Analysis on 1 November 23 with BTCUSD Analysis Da...

Read More >
Fortinet Inc.(FTNT:NASDAQ) Elliott Wave Technical Analysis 12 October 23

Fortinet Inc.(FTNT:NASDAQ) Elliott Wave Technical Analysis 12 October 23

Fortinet Inc.,(FTNT: NASDAQ) Elliott Wave Technical Analysis 4-hour Chart and 1-hour Chart.

Read More >
Looking to Capitalize on Short-term Pullbacks and Market Movements: NEO Crypto Price News and NEOUSD Elliott Wave Analysis

Looking to Capitalize on Short-term Pullbacks and Market Movements: NEO Crypto Price News and NEOUSD Elliott Wave Analysis

This article provides a detailed Elliott Wave Analysis for NEOUSD, covering daily and 4-hour charts....

Read More >

Buy 1 Month

Get 3 Months!

Special Offer:

Trade Recommendations

Unleash the power of deversified trading with our comprehensive portfolio, covering:

  • Stock Trades
  • Crypto Trades
  • Forex Trades
  • Commodity Trades
Elliott Wave Analysis

Gain a competive edge with expert insights in to:

  • Global Indices
  • US Stocks & ASX Stocks
  • Forex & Crypto
  • Commodities
Top-Notch Trading Tools

Equip yourself with the tools of success:

  • Social Chat
  • Elliott Wave Algorithm
  • Screener
  • TradingLevels
  • Trading Game
7 Elliott Wave Analysts

Stay ahead of the market with daily charts and insightful videos
-Your secret to strategic trading!

JOIN HERE


Welcome to TradingLounge (ASIC A.R.No. 321187), specialists in trades, trading education and technical analysis, covering stocks, indices, commodities, forex and cryptocurrencies.

When you join TradingLounge you have access to everything we offer, including trade tools, educational content and a social platform to chat with like-minded investors.

Read more

@Copyright 2024 by tradinglounge.com

Contact Us

Australian no: 02 4787 6020

International no: +61 (2) 47876020

Pay with:

Find us on