08Mar

Natural Gas Elliott Wave Technical Analysis: NG Experiencing a Bearish Trend Persists

Natural Gas Elliott Wave Analysis - bearish trend persists

Natural Gas Elliott Wave Technical Analysis

Function - Trend

Mode - Impulsive

Structure - Impulse Wave

Position - Black wave 4 of red wave (3)

Direction - Black wave 5 of red wave (3)

Natural Gas (NG) embarked on a minor rally between late February and early March, marking a recovery of over 31%. However, this ascent encountered a formidable barrier, casting a shadow over the recovery journey from the low of $1.51. Despite this recovery surge, the bears appear resolute in their stance, and the Elliott wave theory provides additional confirmation that NG prices are poised for further faltering in the forthcoming weeks.

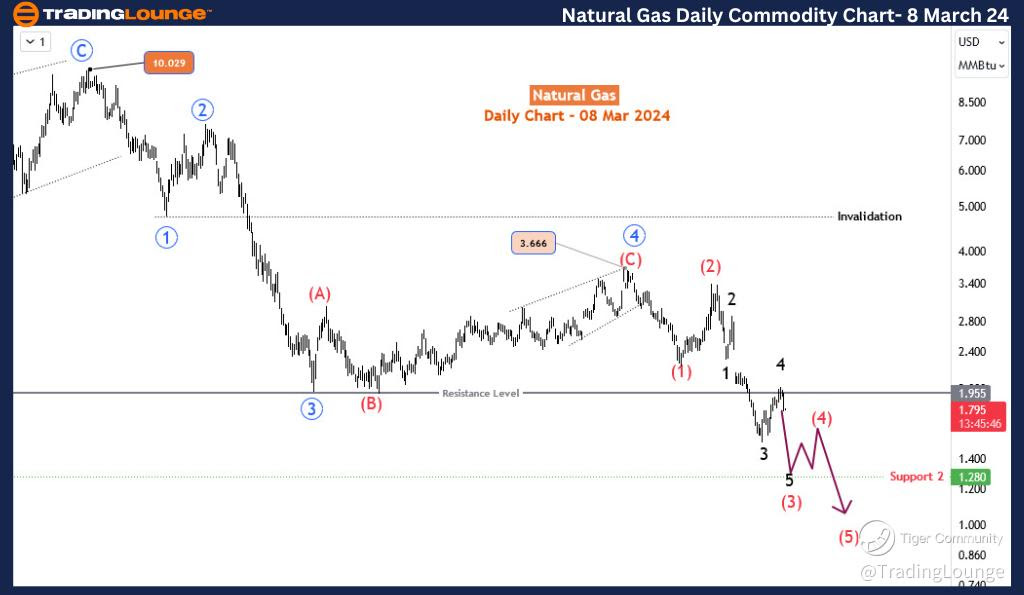
Natural Gas Daily Chart Analysis, 8 March 24

Examining the daily time frame reveals a clear continuation of the bearish impulse wave trend originating from $10 in August 2022. This analysis has been reiterated a few times in recent weeks. The completion of the 4th wave of this downward trajectory (denoted as the blue primary degree) occurred at 3.666. Subsequently, the 5th wave has assumed control, unfolding as an impulse wave and presently finalizing its third sub-wave (termed red intermediate degree). Thus, the current position resides within wave (3) of blue 4. Further scrutiny into wave (3) indicates that it’s completing wave 4 of (3), projected to terminate near the psychological level of $2. The recent market reaction aligns closely with this forecast, and absent unforeseen developments, wave 5 of (3) is anticipated to continue its downward trajectory, as evidenced on the H4 chart.

Natural-Gas-day-comm...


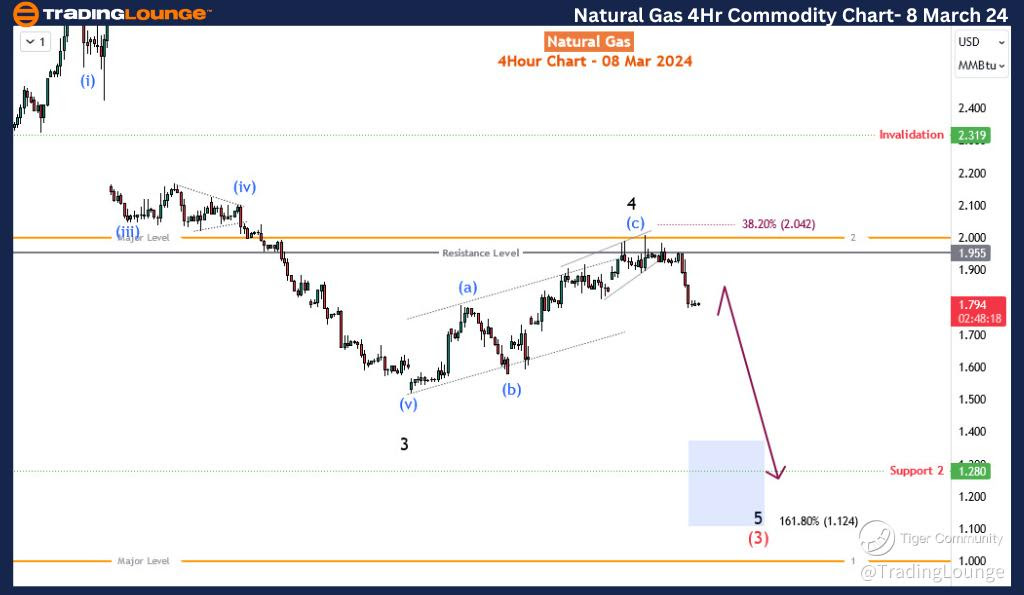
Natural Gas Daily 4-Hour Analysis, 8 March 24

Detailed analysis of the H4 chart delineates the conclusion of wave 4, characterized by a zigzag pattern, with wave (c) culminating in a diagonal formation. The breach beneath the diagonal boundary serves as an early indication of an impending decline in wave 5, ultimately leading to the completion of wave (3). Consequently, a further descent toward the range of 1.28-1.124 (constituting the 161.8% Fibonacci extension of wave 1-3 from 4) is anticipated. Any unforeseen surge beyond 2.319 would invalidate this projection, although such an outcome appears improbable. Looking ahead, the projected culmination of wave (3) does not signify the conclusion of the overall bearish progression initiated in 2022, as wave (4) pullback and wave (5) sell-off remain imminent within this bearish sequence.

In summation, Natural Gas is poised for a continued downward trajectory. By extrapolation, the bearish trend stemming from August 2022's $10 mark could persist, potentially reaching $1 in the ensuing months.

Technical Analyst: Sanmi Adeagbo

Source: visit Tradinglounge.com and learn From the Experts Join TradingLounge Here 

See Previous: WTI Crude Oil

TradingLounge Once Off SPECIAL DEAL: Here > 1 month Get 3 months.   

Natural-Gas-4hr-comm...

Related

Understanding of ChainLink Crypto Price News through LINKUSD Elliott Wave Technical Analysis

Understanding of ChainLink Crypto Price News through LINKUSD Elliott Wave Technical Analysis

Gain a thorough understanding of ChainLink (LINKUSD) through Elliott Wave analysis. This guide provi...

Read More >
Theta Token/U.S. dollar(THETAUSD) Elliott Wave Technical Analysis 30 October 23

Theta Token/U.S. dollar(THETAUSD) Elliott Wave Technical Analysis 30 October 23

Elliott Wave Analysis TradingLounge Daily Chart, 30 October 23,Theta Token/U.S. dollar(THETAUSD)THET...

Read More >
In-Depth Elliott Wave Technical  Analysis and Strategic Price Forecast:Copper Commodity

In-Depth Elliott Wave Technical Analysis and Strategic Price Forecast:Copper Commodity

Delve into our in-depth Copper Elliott Wave analysis for June 2024. This report provides a thorough ...

Read More >
New Zealand Dollar/U.S.Dollar (NZDUSD) Elliott Wave Technical Analysis 7 December 23

New Zealand Dollar/U.S.Dollar (NZDUSD) Elliott Wave Technical Analysis 7 December 23

NZDUSD Elliott Wave Analysis Trading Lounge Day Chart dated 7 December 23, provides a comprehensive ...

Read More >
Meta Platforms Inc.(META:NYSE) Elliott Wave Technical Analysis 19 January 24

Meta Platforms Inc.(META:NYSE) Elliott Wave Technical Analysis 19 January 24

Meta Platforms Inc.(META: NASDAQ) Elliott Wave Technical Analysis dated 19 January 24. Meta Stock An...

Read More >
AMCOR PLC Stock with detailed chart analysis– AMC Stock Analysis & AMC Elliott Wave Technical Forecast

AMCOR PLC Stock with detailed chart analysis– AMC Stock Analysis & AMC Elliott Wave Technical Forecast

This article provides an in-depth Elliott Wave analysis of AMCOR PLC (AMC) on the Australian Stock E...

Read More >

Buy 1 Month

Get 3 Months!

Special Offer:

Trade Recommendations

Unleash the power of deversified trading with our comprehensive portfolio, covering:

  • Stock Trades
  • Crypto Trades
  • Forex Trades
  • Commodity Trades
Elliott Wave Analysis

Gain a competive edge with expert insights in to:

  • Global Indices
  • US Stocks & ASX Stocks
  • Forex & Crypto
  • Commodities
Top-Notch Trading Tools

Equip yourself with the tools of success:

  • Social Chat
  • Elliott Wave Algorithm
  • Screener
  • TradingLevels
  • Trading Game
7 Elliott Wave Analysts

Stay ahead of the market with daily charts and insightful videos
-Your secret to strategic trading!

JOIN HERE


Welcome to TradingLounge (ASIC A.R.No. 321187), specialists in trades, trading education and technical analysis, covering stocks, indices, commodities, forex and cryptocurrencies.

When you join TradingLounge you have access to everything we offer, including trade tools, educational content and a social platform to chat with like-minded investors.

Read more

@Copyright 2024 by tradinglounge.com

Contact Us

Australian no: 02 4787 6020

International no: +61 (2) 47876020

Pay with:

Find us on