18Mar

Texas Instruments Inc.,  (TXN) Elliott Wave Technical Analysis: Potential Upside Momentum Signals on Daily and 4-Hour Charts.

Texas Instruments Inc., (TXN) Daily Chart Elliott Wave Analysis

TXN Elliott Wave Analysis Trading Lounge

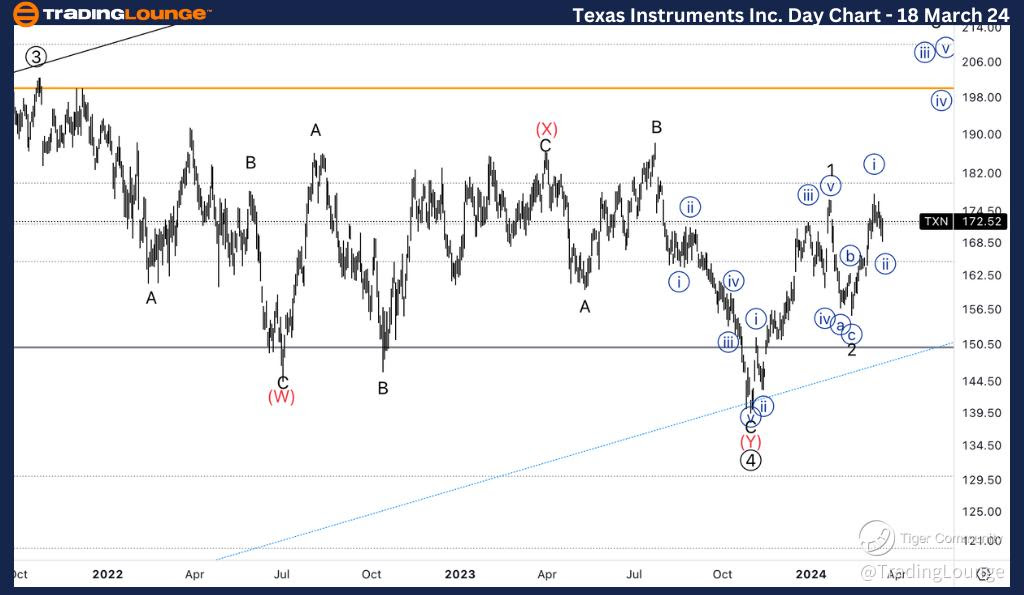
Texas Instruments Inc.,  (TXN) Daily Chart Analysis

TXN Elliott Wave Technical Analysis

Texas Instruments Inc., (TXN) exhibits intriguing Elliott Wave patterns on its daily chart. The analysis suggests a prominent trend characterized by an impulsive mode, indicative of a motive structure. At its current position, TXN appears to be in Minor Wave 3, signalling an upside direction poised to advance within this wave.

This analysis highlights a notable three-wave movement from the $200 all-time high (ATH), displaying corrective tendencies that seem to have concluded. With this corrective phase potentially behind us, attention turns to the likelihood of the uptrend resuming within Primary Wave 5, providing traders with compelling insights into future price actions.

Texas-Instruments-Da...


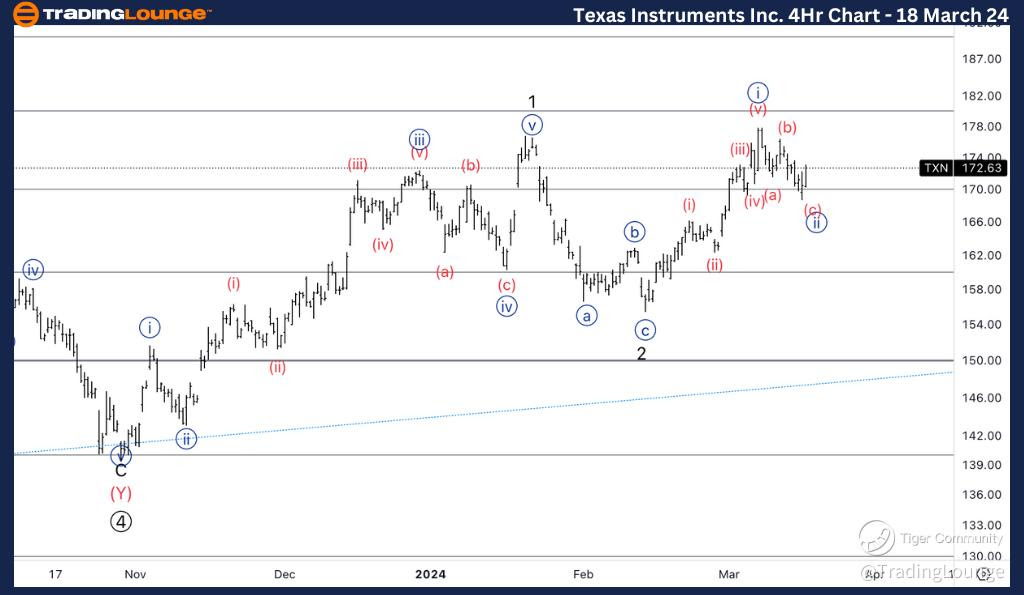
Texas Instruments Inc., (TXN) 4-Hour Chart Elliott Wave Analysis

Texas Instruments Inc., (TXN) 4Hr Chart Analysis

TXN Elliott Wave Technical Analysis

Delving deeper into TXN's market dynamics, the 4-hour chart reveals further intriguing Elliott Wave patterns, reinforcing the potential for upward momentum. The analysis on this timeframe echoes the impulsive trend mode and motive structure observed on the daily chart.

Presently, TXN appears positioned at Wave (i) of {iii}, signaling an upside trajectory into Minute wave {iii}. Market observers anticipate a three-wave movement into wave {ii}, followed by a continuation of the upward momentum into wave {iii}. With wave 1's high surpassed, traders may find increased confidence in the likelihood of an overall uptrend resumption.

By synthesizing these insights from both daily and 4-hour charts, traders gain a comprehensive understanding of TXN's Elliott Wave dynamics, enabling them to make informed decisions regarding potential trading strategies.

Key Takeaways:

  • TXN's Elliott Wave analysis suggests a trend characterized by impulsive behaviour and a motive structure.
  • The daily chart indicates the possibility of the uptrend resuming within Primary Wave 5 after a corrective three-wave movement.
  • On the 4-hour chart, TXN exhibits patterns supportive of upward momentum, with Wave (i) of {iii} signalling potential upside into Minute wave {iii}.
  • Traders may find increased confidence in TXN's upward trajectory, especially with the surpassing of wave 1's high.

In conclusion, the Elliott Wave analysis of Texas Instruments Inc., (TXN) provides valuable insights for traders seeking to capitalize on potential market opportunities. By understanding the impulsive nature and motive structure of TXN's current trend, traders can develop effective strategies to navigate the market with confidence.

Technical Analyst: Alessio Barretta

Source: visit Tradinglounge.com and learn From the Experts Join TradingLounge Here 

See Previous: The Procter & Gamble Company (PG) 

TradingLounge Once Off SPECIAL DEAL: Here > 1 month Get 3 months.

Texas-Instruments-4H...

Related

Delves into the Cocoa Commodity Market Analysis through Elliott Wave Theory, Focusing on the Current Corrective Phase

Delves into the Cocoa Commodity Market Analysis through Elliott Wave Theory, Focusing on the Current Corrective Phase

This article delves into the cocoa market analysis through Elliott Wave Theory, focusing on the curr...

Read More >
Crisp Stock Market Analysis and Winning Trading Strategies for AAPL, TSLA, AMZN, NVDA, MSFT, and More

Crisp Stock Market Analysis and Winning Trading Strategies for AAPL, TSLA, AMZN, NVDA, MSFT, and More

comprehensive stock market analysis and trading strategy overview for various prominent stocks, incl...

Read More >
Buying TSX Composite Stocks or Analyzing ETFs This Guide Provides Essential Updates: S&P/TSX 60 Index Elliott Wave Technical Analysis

Buying TSX Composite Stocks or Analyzing ETFs This Guide Provides Essential Updates: S&P/TSX 60 Index Elliott Wave Technical Analysis

Explore in-depth Elliott Wave analysis of the S&P/TSX Composite with actionable trading strategies a...

Read More >
Larsen & Toubro Stocks Elliott Wave Technical Analysis: Understand LT Share Price targets and Market Sorecasts

Larsen & Toubro Stocks Elliott Wave Technical Analysis: Understand LT Share Price targets and Market Sorecasts

This article provides an in-depth Elliott Wave analysis for Larsen & Toubro (LT), covering daily and...

Read More >
Unlocking ASX Trading Success: V300AEQ ETF UNITS – VAS Stock Analysis & Elliott Wave Technical Forecast

Unlocking ASX Trading Success: V300AEQ ETF UNITS – VAS Stock Analysis & Elliott Wave Technical Forecast

This article provides an in-depth Elliott Wave technical analysis of the ASX VAS ETF Units, highligh...

Read More >
Key Levels and Patterns that Could Impact Visa's Stock Price: Visa Inc. (V) Stocks Elliott Wave Technical Analysis

Key Levels and Patterns that Could Impact Visa's Stock Price: Visa Inc. (V) Stocks Elliott Wave Technical Analysis

Our detailed Elliott Wave analysis for Visa Inc. (V) explores both daily and 1-hour charts to provid...

Read More >

Buy 1 Month

Get 3 Months!

Special Offer:

Trade Recommendations

Unleash the power of deversified trading with our comprehensive portfolio, covering:

  • Stock Trades
  • Crypto Trades
  • Forex Trades
  • Commodity Trades
Elliott Wave Analysis

Gain a competive edge with expert insights in to:

  • Global Indices
  • US Stocks & ASX Stocks
  • Forex & Crypto
  • Commodities
Top-Notch Trading Tools

Equip yourself with the tools of success:

  • Social Chat
  • Elliott Wave Algorithm
  • Screener
  • TradingLevels
  • Trading Game
7 Elliott Wave Analysts

Stay ahead of the market with daily charts and insightful videos
-Your secret to strategic trading!

JOIN HERE


Welcome to TradingLounge (ASIC A.R.No. 321187), specialists in trades, trading education and technical analysis, covering stocks, indices, commodities, forex and cryptocurrencies.

When you join TradingLounge you have access to everything we offer, including trade tools, educational content and a social platform to chat with like-minded investors.

Read more

@Copyright 2024 by tradinglounge.com

Contact Us

Australian no: 02 4787 6020

International no: +61 (2) 47876020

Pay with:

Find us on