USDJPY Elliott Wave Analysis Trading Lounge Day Chart,
U.S.Dollar/Japanese Yen(USDJPY) Day Chart
USDJPY Elliott Wave Technical Analysis
FUNCTION: Counter Trend
MODE: Impulsive as C
STRUCTURE: blue wave C
POSITION: Black wave Z of B
DIRECTION NEXT LOWER DEGREES: black wave C
DETAILS blue wave C of Z is in play , after that new trend as black wave C expected.
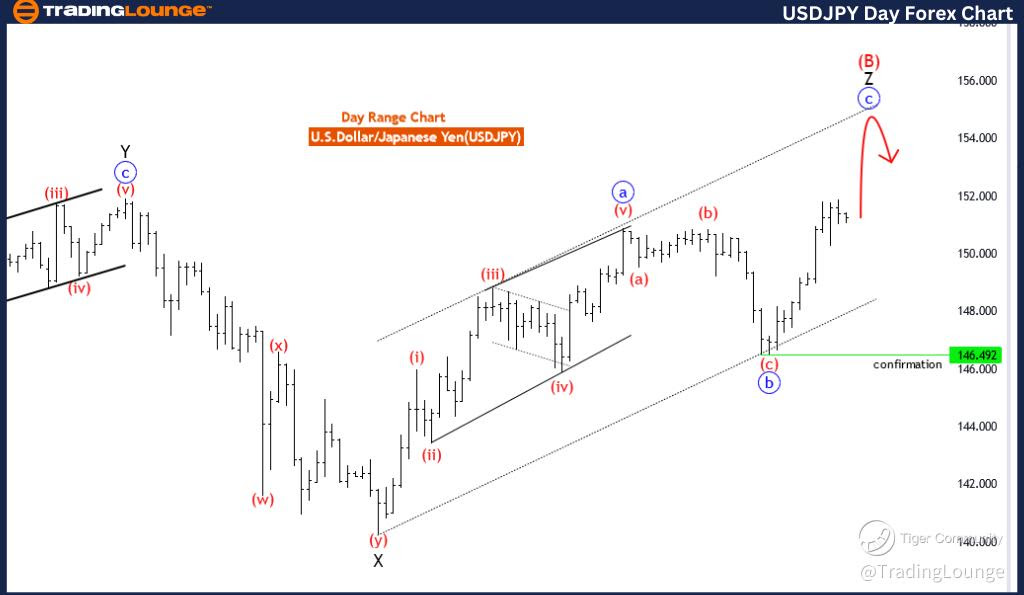
The USDJPY Elliott Wave Analysis for the day chart provides insights into the potential price movements of the U.S. Dollar/Japanese Yen currency pair, utilizing Elliott Wave principles for technical analysis.
Identified as a "Counter Trend" scenario, the analysis suggests that the current market direction opposes the prevailing trend, indicating a corrective phase or potential reversal from the predominant price action.
Described as "Impulsive as C" in mode, the analysis implies that the ongoing corrective phase exhibits characteristics of an impulsive wave pattern within the broader Elliott Wave cycle. This suggests that despite being a counter-trend move, the corrective phase may display strong momentum.
The "STRUCTURE" is identified as "blue wave C," indicating the current wave count within the corrective phase. This helps traders understand the ongoing correction's structure and potential targets within the corrective pattern.
Positioned as "Black wave Z of B," the analysis provides insights into the current wave count within the broader corrective structure. This information aids traders in anticipating potential reversal levels or corrective targets within the corrective phase.
The "DIRECTION NEXT LOWER DEGREES" is stated as "black wave C," suggesting the anticipated direction for the subsequent lower-degree wave. This implies that once the current corrective phase completes, the market may resume its downward movement within the broader Elliott Wave cycle.
In the "DETAILS" section, it is noted that "blue wave C of Z is in play, after that new trend as black wave C is expected." This indicates that the current corrective phase is ongoing, with the expectation of further downside movement before a potential reversal and the start of a new trend.
In summary, the USDJPY Elliott Wave Analysis for the day chart offers traders valuable insights into potential price movements, corrective phases, and critical levels to monitor within the broader Elliott Wave structure, aiding in informed trading decisions.
USDJPY Elliott Wave Analysis Trading Lounge 4 Hour Chart,
U.S.Dollar/Japanese Yen(USDJPY) 4 Hour Chart
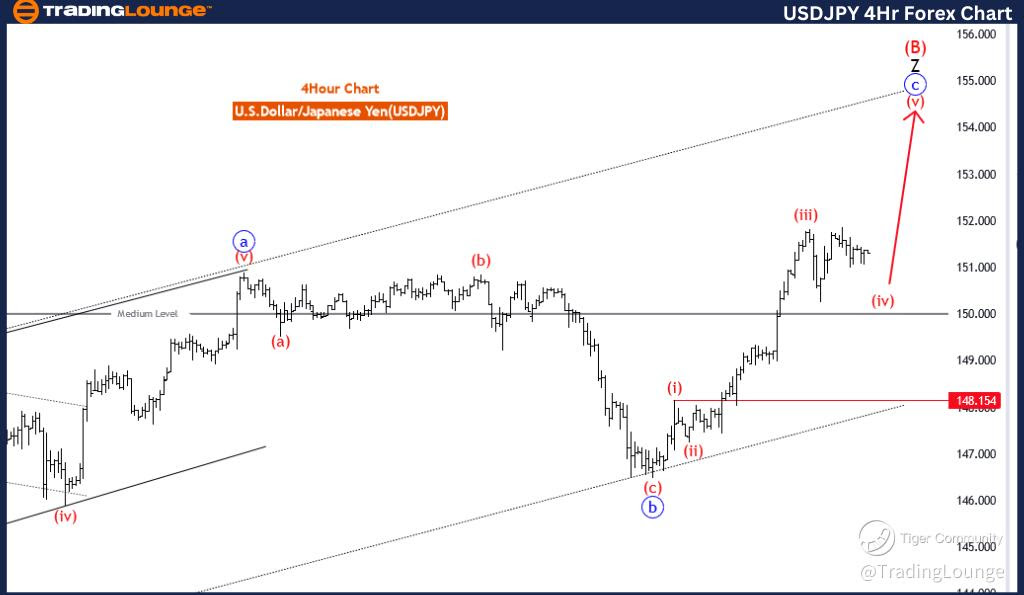
USDJPY Elliott Wave Technical Analysis
FUNCTION: Counter Trend
MODE: Impulsive as C
STRUCTURE: red wave 4
POSITION: blue wave C
DIRECTION NEXT HIGHER DEGREES: red wave 5
DETAILS red wave 4 of C is in play , after that red wave 5 of C will start. Wave Cancel invalid level: 148.154
The USDJPY Elliott Wave Analysis for the 4-hour chart presents insights into the potential price movements of the U.S. Dollar/Japanese Yen currency pair, employing Elliott Wave principles for technical analysis.
Described as a "Counter Trend" scenario, the analysis suggests that the current market direction runs counter to the broader trend, indicating a corrective phase or possible reversal from the prevailing price action.
Defined as "Impulsive as C" in mode, the analysis implies that the current corrective phase exhibits characteristics of an impulsive wave pattern within the broader Elliott Wave cycle. This suggests that despite being a counter trend move, the corrective phase may display strong momentum.
The "STRUCTURE" is identified as "red wave 4," indicating that the market is currently within the fourth wave of a corrective pattern. This signifies a temporary interruption in the larger trend before a potential continuation or reversal.
Positioned as "blue wave C," the analysis provides insights into the current wave count within the corrective phase. This helps traders anticipate potential reversal levels or corrective targets within the corrective structure.
The "DIRECTION NEXT HIGHER DEGREES" is stated as "red wave 5," suggesting the anticipated direction for the subsequent higher-degree wave. This implies that once the current corrective phase completes, the market may resume its upward movement within the broader Elliott Wave cycle.
In the "DETAILS" section, it is noted that "red wave 4 of C is in play, after that red wave 5 of C will start." This indicates that the current corrective phase is ongoing, with the expectation of further downside movement before a potential reversal.
The "Wave Cancel invalid level" is specified as 148.154, serving as a critical threshold. A breach beyond this level would invalidate the current wave count, prompting a reassessment of the analysis.
In summary, the USDJPY Elliott Wave Analysis for the 4-hour chart offers traders valuable insights into potential price movements, corrective phases, and critical levels to monitor within the broader Elliott Wave structure.
Technical Analyst: Malik Awais
Source: visit Tradinglounge.com and learn From the Experts Join TradingLounge Here
See Previous: British Pound/ Australian Dollar(GBPAUD)
TradingLounge Once Off SPECIAL DEAL: Here > 1 month Get 3 months.