WTI Elliott Wave Analysis: Navigating the Corrective Zigzag in Oil Prices
WTI Crudeoil Elliott Wave Technical Analysis
Function: Counter-trend
Mode: Corrective
Structure: Zigzag
Position: Wave (b) of ‘y’
Direction: Active
Understanding the Current Phase of the WTI Price Movement
Wave (b) of ‘y’ is Underway: Presently, we are observing a pullback in the price of WTI crude oil, consistent with the anticipated corrective pattern of wave (b) of 'y'. This phase is expected to find solid support in the range of $80 to $79, an area referred to as the "blue zone". The subsequent phase, wave (c), is predicted to initiate from this point, marking a pivotal moment in the current market trend.
Since mid-December 2023, WTI has exhibited a corrective ascent, appreciating by approximately 20%. Despite this upward correction, a broader analysis suggests an impending return to the bearish trend initiated in September 2023. This bearish momentum could potentially push prices below the $67 mark, reaching depths of $64.5, or at least adjusting to a range between $75 and $70.
Anticipating the Final Bullish Movement: Revisiting the corrective rally that started in mid-December, there’s an expectation for an additional upward movement, possibly reaching $83.5 or even higher. This move is predicted before the resumption of the predominant bearish trend. Our objective in this analysis is to pinpoint the upcoming opportunities within the corrective rally’s trajectory, leading up to its eventual peak.
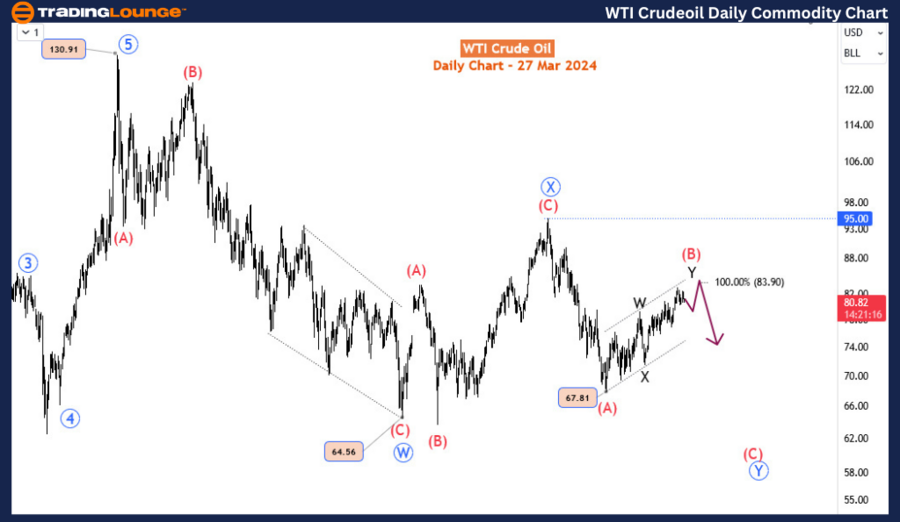
Daily Chart Perspective: The price decline from the March 2022 peak of 130.9 is unfolding into a double zigzag pattern. The first wave, W, culminated at $64.5 in March 2023, followed by a rally for wave X that ended at $95 in September 2023. The current descending pattern, identified as wave Y, is expected to mirror the structure of the initial two segments. With wave (A) concluding in December 2023, the rally from $67.8 is classified as wave (B), potentially forming a double zigzag. The anticipated endpoint for wave Y could be in the vicinity of $83.5 to $84, representing a significant extension.
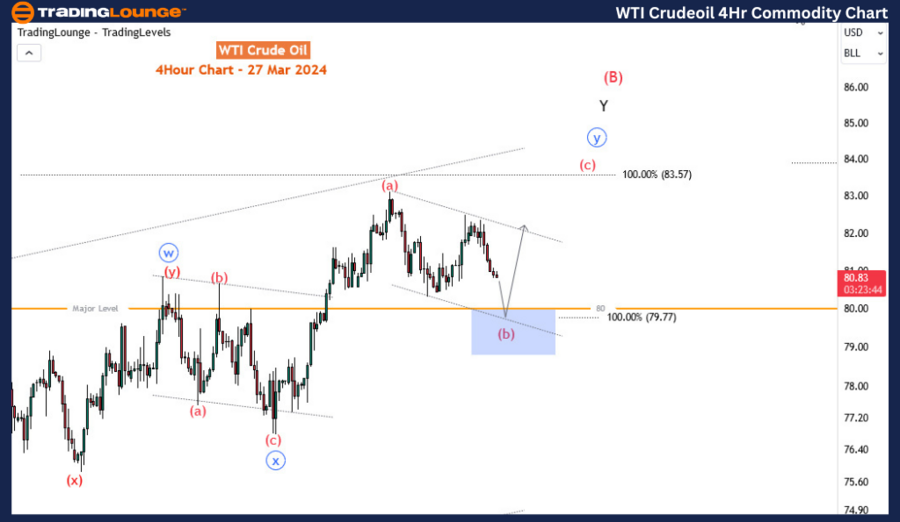
WTI Crudeoil Elliott Wave Analysis Trading Lounge 4-Hour Chart
WTI Crudeoil 4-Hour Chart Analysis:
Four-Hour Chart Insights: Within the finer granularity of the 4-hour time frame, wave Y is discerned as a double zigzag pattern. Currently, in wave (b) of Y, this phase is executing a double three (zigzag) formation. The critical level of support for wave (b) is identified as around $80, potentially extending just below the designated blue zone. This support zone is crucial for fostering the conditions necessary for wave (c) to propel the price towards $83.5-$84, marking a decisive phase in the bullish trend that began in December 2023.
Strategic Implications for Traders
For traders and analysts following the Elliott Wave principle, the current phase of WTI’s price movement offers a nuanced understanding of the market’s corrective patterns. By closely monitoring the support levels within the blue zone and anticipating the initiation of wave (c), strategic positions can be aligned with the potential upward movement towards $83.5-$84. This analysis underscores the importance of wave (b)’s completion and the imminent transition into wave (c), providing valuable insight into the short-term bullish opportunities before the overarching bearish trend resumes.
In essence, the WTI Elliott Wave Analysis serves as a crucial tool for navigating the volatile oil market, offering a structured approach to understanding price movements and making informed trading decisions.
Technical Analyst: Sanmi Adeagbo
Source: visit Tradinglounge.com and learn From the Experts Join TradingLounge Here
See Previous: Coffee
TradingLounge Once Off SPECIAL DEAL: Here > 1 month Get 3 months.