GX Uranium Elliott Wave Analysis

Uranium Elliott Wave Technical Analysis

Function - Counter trend

Mode - Corrective

Structure - Emerging Flat

Position - Red wave (B) of blue 4 

Direction - Red wave (C) should begin

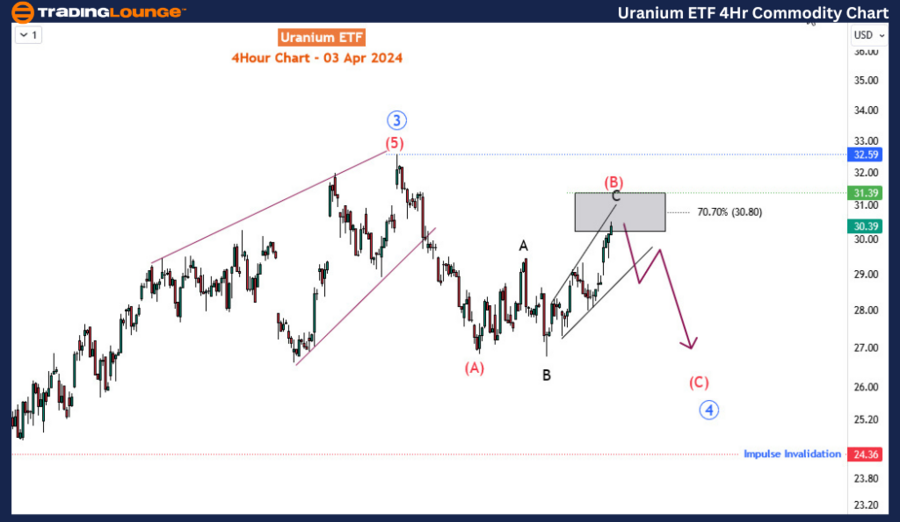
Details - Wave (B) hits above $30. Price could reach 30.80-31.39 before completing wave (B). We will have to see a sharp return below 30 to confirm the start of wave (C)

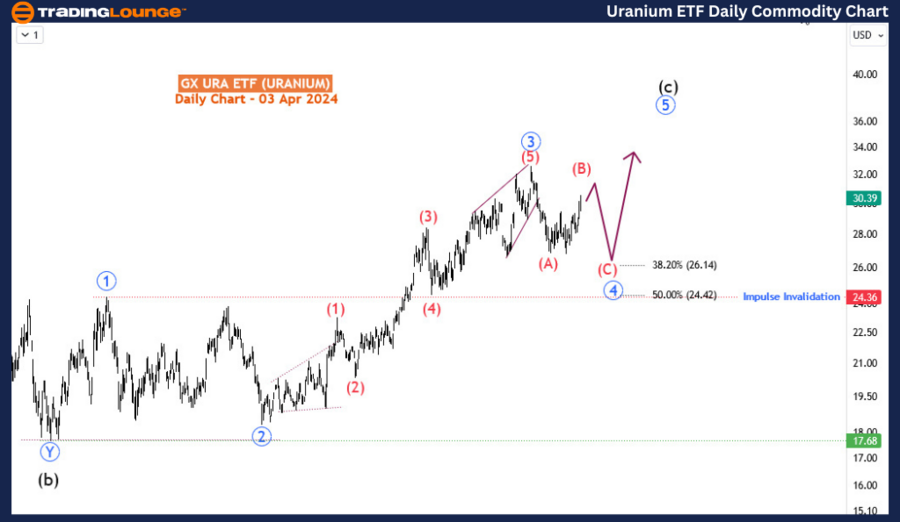
The GX Uranium ETF (URA) has been on a recovery path since March 26, 2024, albeit characterized as a corrective phase. This suggests a possibility of downside continuation to fulfil the broader retracement initiated on February 1, 2024. However, it's imperative to view this within the context of the larger trend, which indicates a continuation of the upward momentum that began on July 7, 2022, once the current pullback concludes. In today's discussion, we'll explore potential trading opportunities for both the short and medium term in URA.

Uranium Daily Chart Analysis: Analyzing the daily timeframe, the ETF has been in an impulse rally since July 2022, with waves 1 to 3 (highlighted in blue) completed before the onset of the corrective wave 4 (also circled in blue) on February 1, 2024, commencing at 32.59. This corrective wave 4 has progressed to some extent, completing sub-wave (A) on February 23, 2024, at 26.88, followed by a rebound for wave (B). Examination of the sub-waves within (B) reveals an expanding flat pattern, as evidenced by the H4 chart.
Uranium-daily-commod...


GX Uranium Elliott Wave Analysis Trading Lounge 4-Hour Chart

Uranium 4-Hour Chart Analysis:

Zooming in on the H4 timeframe, we observe that waves A and B have each completed 3-wave structures typical of flat patterns, characterized by their 3, 3, 5 structure. Currently, wave C is nearing completion, taking the form of an expanding diagonal pattern as it approaches a critical zone between 30.39 and 31.39. Anticipation of a bearish reaction from this zone is valid. However, confirmation of the initiation of wave (C) necessitates a sharp break below the lower boundary line of the diagonal. As selling pressure intensifies, wave (C) is projected to extend lower towards the 26.5-25.5 range.

Alternatively, if the ongoing rally surpasses the aforementioned zone to the upside, the likelihood of this forecast diminishes, especially as the price approaches the invalidation point at 32.59. In such a scenario, it would suggest that wave 5 (highlighted in blue) is currently unfolding, indicating that blue wave 4 has already completed at 26.79. Traders should closely monitor these key levels and adjust their strategies accordingly to capitalize on potential trading opportunities presented by URA's price action.

Technical Analyst: Sanmi Adeagbo

Source: visit Tradinglounge.com and learn From the Experts Join TradingLounge Here 

See Previous: Corn Commodity

TradingLounge Once Off SPECIAL DEAL: Here > 1 month Get 3 months.   

TradingLounge's Free Week Extravaganza!

April 14 – 21: Unlock the Doors to Trading Excellence — Absolutely FREE
Uranium-4Hr-commodit...

Related

Vanguard Australian shares Index V300AEQ ETF UNITS – VAS Stock Analysis & Elliott Wave Technical Forecast

Vanguard Australian shares Index V300AEQ ETF UNITS – VAS Stock Analysis & Elliott Wave Technical Forecast

This detailed analysis covers the ASX ETF VAS (V300AEQ), focusing on Elliott Wave trends, technical ...

Read More >
ChainLink/U.S. dollar(LINKUSD) Elliott Wave Technical Analysis 24 January 24

ChainLink/U.S. dollar(LINKUSD) Elliott Wave Technical Analysis 24 January 24

ChainLink and U.S. dollar Elliott Wave Technical Analysis dated 24 January 24 in which TradingLounge...

Read More >
NIFTY 50 (India) Elliott Wave Technical Analysis: Insights into Corrective Waves, Invalidation Levels, and Key Market Trends for Traders

NIFTY 50 (India) Elliott Wave Technical Analysis: Insights into Corrective Waves, Invalidation Levels, and Key Market Trends for Traders

Get a comprehensive overview of NIFTY 50 Elliott Wave analysis, covering daily and weekly chart insi...

Read More >
Gold (XAUUSD) Commodity Elliott Wave Technical Analysis: Examining the latest trends and price movements

Gold (XAUUSD) Commodity Elliott Wave Technical Analysis: Examining the latest trends and price movements

This article provides an in-depth Elliott Wave analysis of the gold market, examining the latest tre...

Read More >
QUALCOMM Inc. (QCOM) Stocks Elliott Wave Technical Analysis: QUALCOMM Stock Trends, Forecasts & Trading Strategies

QUALCOMM Inc. (QCOM) Stocks Elliott Wave Technical Analysis: QUALCOMM Stock Trends, Forecasts & Trading Strategies

This QCOM Elliott Wave analysis provides an in-depth look at QUALCOMM stock's corrective pattern...

Read More >
Strategies for Forex Traders aiming to Capitalize on the EURUSD Market Trends: Euro/ U.S. Dollar Elliott Wave Technical Analysis

Strategies for Forex Traders aiming to Capitalize on the EURUSD Market Trends: Euro/ U.S. Dollar Elliott Wave Technical Analysis

This comprehensive analysis provides an in-depth look at the EURUSD using Elliott Wave Theory. Disco...

Read More >

Buy 1 Month

Get 3 Months!

Special Offer:

Trade Recommendations

Unleash the power of deversified trading with our comprehensive portfolio, covering:

  • Stock Trades
  • Crypto Trades
  • Forex Trades
  • Commodity Trades
Elliott Wave Analysis

Gain a competive edge with expert insights in to:

  • Global Indices
  • US Stocks & ASX Stocks
  • Forex & Crypto
  • Commodities
Top-Notch Trading Tools

Equip yourself with the tools of success:

  • Social Chat
  • Elliott Wave Algorithm
  • Screener
  • TradingLevels
  • Trading Game
7 Elliott Wave Analysts

Stay ahead of the market with daily charts and insightful videos
-Your secret to strategic trading!

JOIN HERE


Welcome to TradingLounge (ASIC A.R.No. 321187), specialists in trades, trading education and technical analysis, covering stocks, indices, commodities, forex and cryptocurrencies.

When you join TradingLounge you have access to everything we offer, including trade tools, educational content and a social platform to chat with like-minded investors.

Read more

@Copyright 2024 by tradinglounge.com

Contact Us

Australian no: 02 4787 6020

International no: +61 (2) 47876020

Pay with:

Find us on