Explore TXN Elliott Wave Analysis: Texas Instruments Inc. (TXN) Daily & 4Hr Charts

In this TXN Elliott Wave analysis, we delve into the intricate patterns of Texas Instruments Inc. (TXN) to identify potential trading opportunities. By utilizing Elliott Wave Theory, we aim to discern the market's directional movements, providing valuable insights for traders and investors alike.

TXN Elliott Wave Technical Analysis

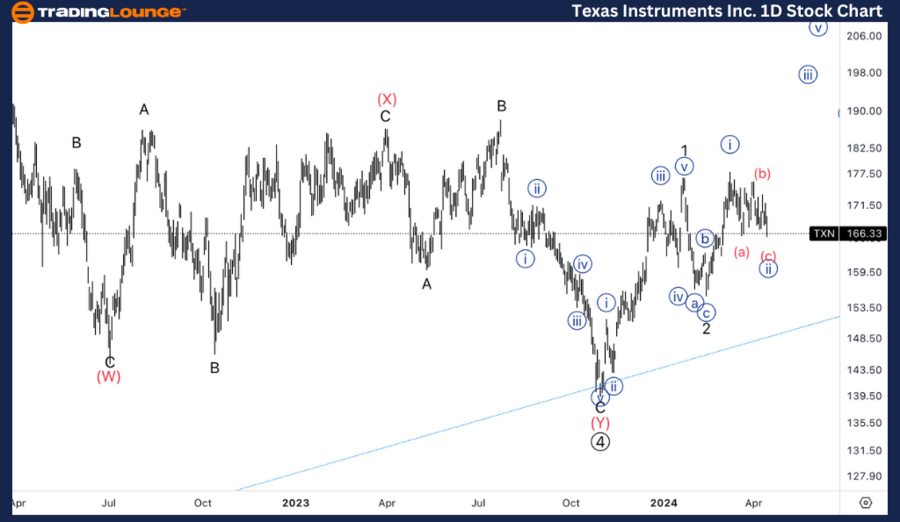
Texas Instruments Inc., (TXN) Daily Chart Analysis

Function: Trend

Mode: Impulsive

Structure: Motive

Position: Minor wave 3

Direction: Upside in wave 3

In our TXN Elliott Wave analysis on the daily chart, we observe a compelling impulsive trend characterized by a motive structure, indicating the presence of Minor wave 3. Our focus lies on discerning whether this wave is undergoing an extension or if it is part of a larger corrective pattern, potentially wave {b} of 2. In the most bearish scenario, the recent upswing from the $140 support might not signify the initiation of wave 1, suggesting the possibility of a broader corrective phase.

Texas-Instruments-In...


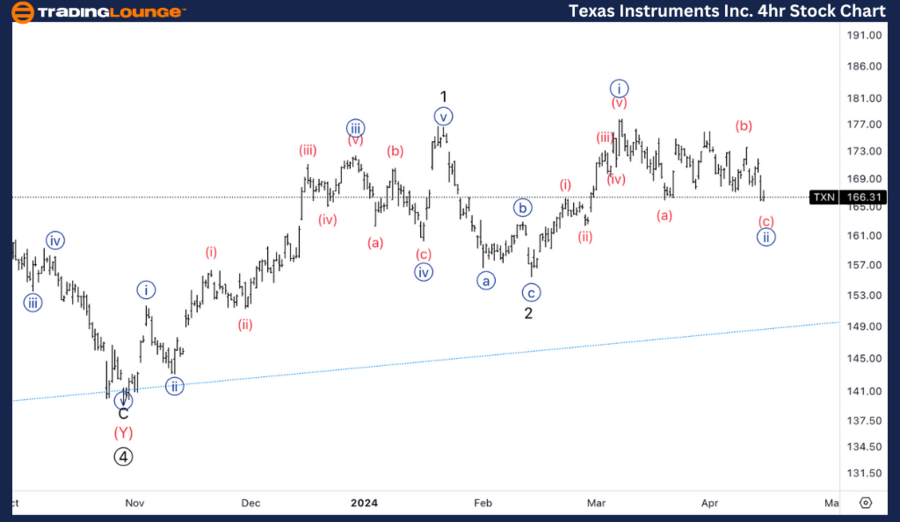
Insights into TXN 4Hr Chart Movements: Texas Instruments Inc. (TXN)

TXN Elliott Wave Analysis

Texas Instruments Inc., (TXN) 4Hr Chart Analysis

Function: Counter Trend

Mode: Corrective

Structure: Flat

Position: Wave {ii}

Direction: Bottom in wave (c) of {ii}

Turning our attention to the 4-hour chart, our TXN Elliott Wave analysis reveals a counter-trend movement characterized by corrective patterns. The structure of wave {ii} appears to form a flat correction, indicating a temporary pause in the prevailing trend. We anticipate completion of the three-wave move within wave {ii}, with the bottom likely to materialize imminently. Our analysis suggests that the support level around $165, marking the onset of MGM2, could serve as a pivotal point for the upcoming price action.

Conclusion

Empower your trading journey with our SEO-optimized TXN Elliott Wave analysis, tailored to enhance your understanding of Texas Instruments Inc. (TXN) market dynamics. Whether you're a seasoned trader or a novice investor, our comprehensive analysis equips you with the insights needed to navigate the ever-changing landscape of financial markets. Unlock the potential for sustainable profits and elevate your trading strategies with our cutting-edge analysis.

Technical Analyst: Alessio Barretta

Source: visit Tradinglounge.com and learn From the Experts Join TradingLounge Here 

See Previous: Amazon.com Inc.Stock Analysis

TradingLounge Once Off SPECIAL DEAL: Here > 1 month Get 3 months.

TradingLounge's Free Week Extravaganza!

April 14 – 21: Unlock the Doors to Trading Excellence — Absolutely FREE

Texas-Instruments-In...

Related

Netflix Inc. (NFLX) Stock Elliott Wave Technical Analysis: Focusing on Price Movements and Stock Bullish Momentum

Netflix Inc. (NFLX) Stock Elliott Wave Technical Analysis: Focusing on Price Movements and Stock Bullish Momentum

This article offers a detailed Elliott Wave analysis of Netflix Inc. (NFLX), focusing on price movem...

Read More >
Polkadot Crypto Price News Today Elliott Wave Technical Analysis of Polkadot (DOT/USD): Comprehensive Guide

Polkadot Crypto Price News Today Elliott Wave Technical Analysis of Polkadot (DOT/USD): Comprehensive Guide

This article provides an in-depth Elliott Wave analysis of Polkadot (DOT/USD), offering insights int...

Read More >
The Elliott Wave Analysis for Texas Instruments Inc. (TXN) Reveals a Bullish Trend, Supported by Both the Daily and 1-hour Charts

The Elliott Wave Analysis for Texas Instruments Inc. (TXN) Reveals a Bullish Trend, Supported by Both the Daily and 1-hour Charts

Our Elliott Wave analysis for Texas Instruments Inc. (TXN) highlights a bullish trend, with both dai...

Read More >
Focusing on Current Trends in the US Dollar / Canadian Dollar Currency Pair: USDCAD Elliott Wave Technical Analysis

Focusing on Current Trends in the US Dollar / Canadian Dollar Currency Pair: USDCAD Elliott Wave Technical Analysis

This article offers a comprehensive USDCAD Elliott Wave analysis, including the latest wave counts, ...

Read More >
Global Stock Market Indices: In-Depth Elliott Wave Analysis of S&P 500, NASDAQ 100, DAX 40 & More

Global Stock Market Indices: In-Depth Elliott Wave Analysis of S&P 500, NASDAQ 100, DAX 40 & More

This analysis provides a comprehensive overview of the S&P 500, NASDAQ 100, Russell 2000, DAX 40, FT...

Read More >
Detailed Meta Elliott Wave Technical Analysis of Meta Platforms Inc.: Daily and 4-Hour Trading Perspectives

Detailed Meta Elliott Wave Technical Analysis of Meta Platforms Inc.: Daily and 4-Hour Trading Perspectives

This detailed analysis of Meta Platforms Inc (META) employs Elliott Wave theory to examine the stock...

Read More >

Buy 1 Month

Get 3 Months!

Special Offer:

Trade Recommendations

Unleash the power of deversified trading with our comprehensive portfolio, covering:

  • Stock Trades
  • Crypto Trades
  • Forex Trades
  • Commodity Trades
Elliott Wave Analysis

Gain a competive edge with expert insights in to:

  • Global Indices
  • US Stocks & ASX Stocks
  • Forex & Crypto
  • Commodities
Top-Notch Trading Tools

Equip yourself with the tools of success:

  • Social Chat
  • Elliott Wave Algorithm
  • Screener
  • TradingLevels
  • Trading Game
7 Elliott Wave Analysts

Stay ahead of the market with daily charts and insightful videos
-Your secret to strategic trading!

JOIN HERE


Welcome to TradingLounge (ASIC A.R.No. 321187), specialists in trades, trading education and technical analysis, covering stocks, indices, commodities, forex and cryptocurrencies.

When you join TradingLounge you have access to everything we offer, including trade tools, educational content and a social platform to chat with like-minded investors.

Read more

@Copyright 2024 by tradinglounge.com

Contact Us

Australian no: 02 4787 6020

International no: +61 (2) 47876020

Pay with:

Find us on