WTI Elliott Wave Analysis: A Detailed Look at Current Trends and Future Expectations
WTI Elliott Wave Technical Analysis
Function: Counter-Trend
Mode: Corrective
Structure: Triple Zigzag
Position: Wave X of Triple Zigzag
Direction: Wave Y of the Triple Zigzag
Exploring the Double Zigzag of Wave X in WTI Prices
The recent developments in WTI prices show a compelling double zigzag pattern for Wave X, which has dipped into the Fibonacci support zone after briefly surpassing the critical 80 levels. Despite a deeper potential movement within this zone, prices are anticipated to hold above the critical invalidation level of 75.49. From here, a rebound is likely, marking a crucial juncture in WTI's price trajectory.
Historical Context and Recent Price Movements in US Crude Oil
Since April 12, 2024, US Crude Oil has experienced a significant decrease in prices, shedding nearly 10% of its value. This decline interrupts a robust four-month rally that began in December 2023, during which the commodity appreciated by 29%. The current situation poses a question: will US Crude Oil regain its strength from the December rally, or are these gains at risk in the upcoming weeks or months?
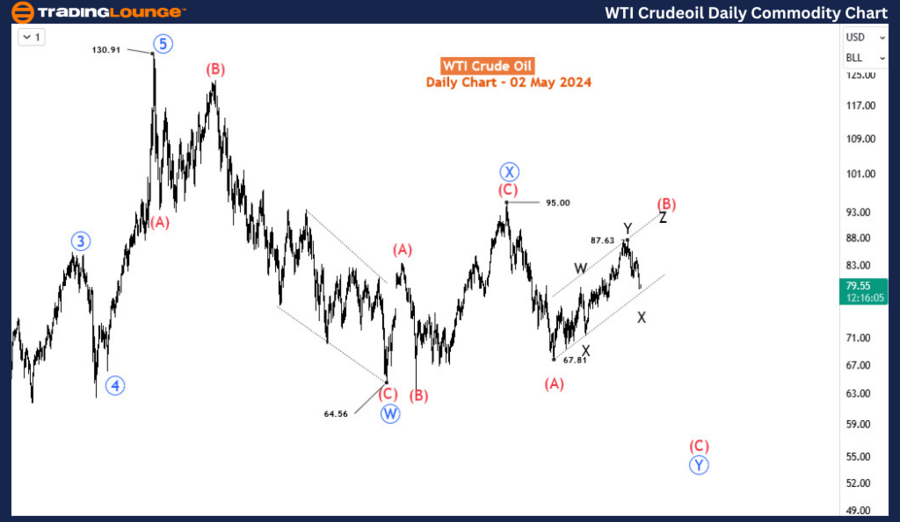
Daily Chart Analysis of the Bearish Cycle from COVID to the Present
The daily chart highlights the bearish cycle retracing the strong impulse rally that occurred from the onset of COVID until the peak of the Russia-Ukraine conflict in March 2022. This retracement is evolving into a double zigzag pattern, labeled W-X-Y (highlighted in blue), of the primary degree. Presently, the price is navigating through the final leg—blue wave Y, which further divides into an (A)-(B)-(C) zigzag structure of intermediate degree.
Insights into Wave (B) and the Potential for a Triple Zigzag
A detailed examination reveals that wave (B) is currently active and has formed a double zigzag. However, the potential for an additional rally could transform this into a triple zigzag. This scenario presents a conflict between a continuing double zigzag and the emergence of a triple zigzag. The resolution of this conflict depends on the subsequent market movements. If the price breaks downwards out of the current channel, confirming a double zigzag, the impulse will likely be completed. Conversely, if the price recovers strongly upwards, completing another corrective structure, the preference will shift towards a triple zigzag.
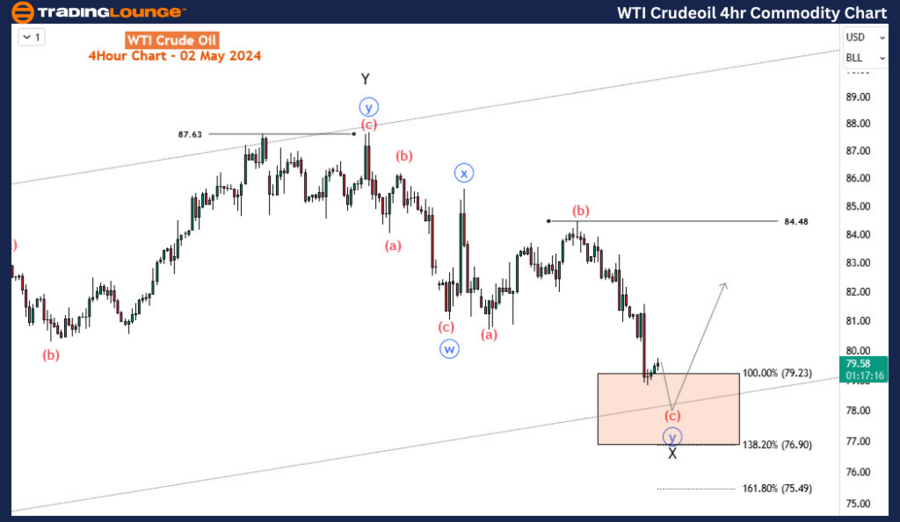
Current Observations from the H4 Chart and Future Predictions
The H4 chart illustrates a double zigzag developing from wave Y. The anticipated support zone lies between 79.23 and 76.90, based on Fibonacci levels, where a strong upward reaction is expected to finalize wave Z of a triple zigzag. This scenario remains the favoured projection. Nevertheless, if the price fails to rebound significantly in this zone and continues to decline below 75.49, the recent drop from Y could be classified as an impulse, suggesting that wave (B) might have concluded at 87.63 with a double zigzag structure.
In conclusion, the WTI Elliott wave analysis underscores a complex pattern of corrections and rallies, with key levels providing critical insight into future movements. Market participants should closely monitor these developments to adjust their strategies accordingly.
Technical Analyst: Sanmi Adeagbo
Source: visit Tradinglounge.com and learn From the Experts Join TradingLounge Here
See Previous: Coffee Commodity Elliott Wave Analysis
Special Trial Offer - 0.76 Cents a Day for 3 Months! Click here
Access 6 Analysts covering over 150 Markets. Chat Room With Support