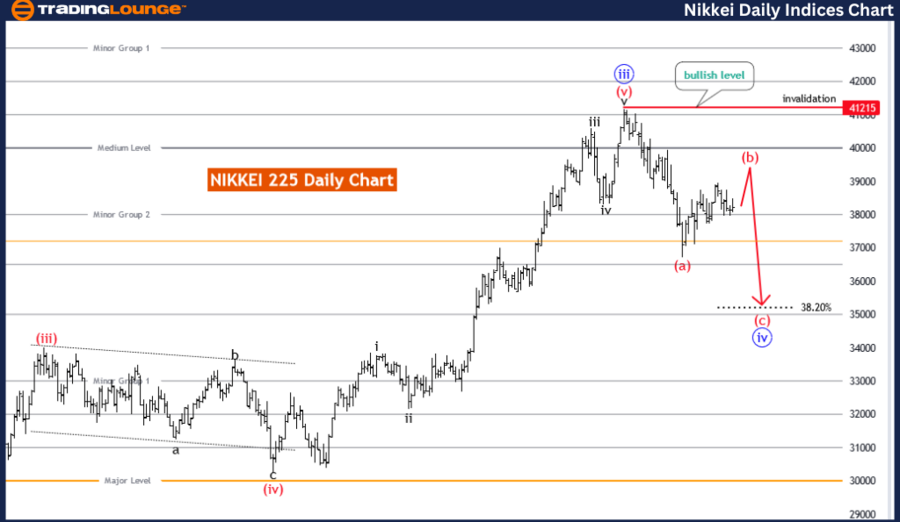
NIKKEI 225(N225) Elliott Wave Analysis Trading Lounge Day Chart,
NIKKEI 225(N225) Elliott Wave Technical Analysis
FUNCTION: Counter Trend
MODE: corrective
STRUCTURE: red wave B
POSITION: Blue Wave 4
DIRECTION NEXT LOWER DEGREES: red wave C
DETAILS: red wave A of 4 is completed, and now red wave B of blue wave 4 is in play.
Wave Cancel invalid level: 41215
The day chart analysis of the NIKKEI 225 (N225) provides a comprehensive overview of the Elliott Wave pattern governing the price movements of this Japanese stock market index, focusing on potential trends and reversals.
Function:
The identified function in the analysis is "Counter Trend," indicating that the NIKKEI 225 is currently exhibiting a temporary deviation from the prevailing trend. This suggests that the market is experiencing a corrective phase within a broader trend, offering opportunities for contrarian trading strategies.
Mode:
The mode specified is "corrective," suggesting that the current price action is part of a corrective wave cycle within the Elliott Wave sequence. This implies that the movement observed in the market is corrective in nature, serving as a temporary interruption to the overall trend direction.
Structure:
The structure highlighted is "red wave B," representing the specific wave count within the corrective phase. This indicates that the NIKKEI 225 is currently undergoing a corrective wave labeled as "red wave B," which is part of a broader corrective pattern.
Position:
The position identified is "blue wave 4," specifying the location of the current wave within the broader Elliott Wave pattern. This implies that the market is advancing within the "blue wave 4" phase of the corrective wave cycle.
Direction for Next Lower Degrees:
The direction indicated for the next lower degrees is "red wave C," suggesting the potential continuation of the corrective wave cycle at a broader degree. This implies that the current corrective movement may extend further before the broader trend resumes.
Details:
The analysis notes that "red wave A" of "blue wave 4" has been completed, signalling the onset of "red wave B." This suggests that the NIKKEI 225 may experience further corrective movement in the near term. The wave cancellation or invalidation level is set at 41215, providing a critical threshold for assessing the validity of the current wave count.
In summary, the day chart analysis of the NIKKEI 225 suggests that the index is undergoing a corrective phase within the broader trend. The corrective structure and identified wave counts offer insights for traders looking to navigate the market and capitalize on potential price movements.
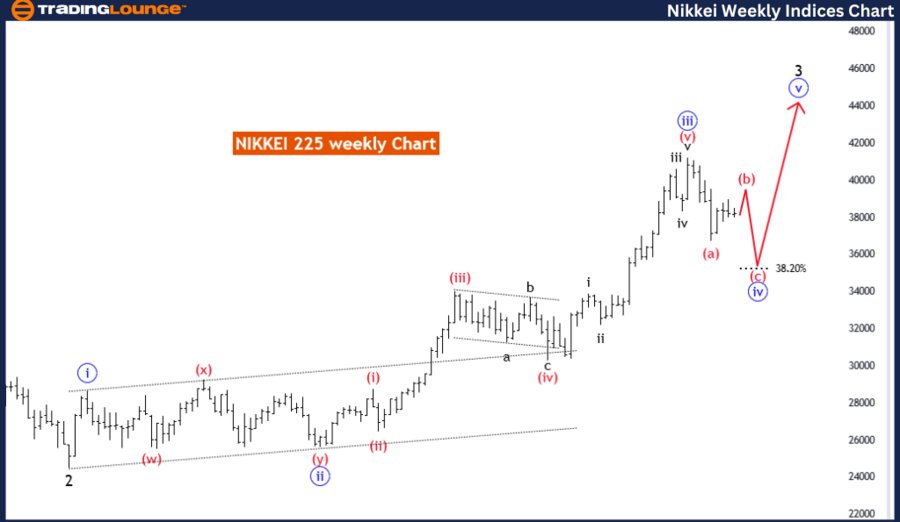
NIKKEI 225(N225) Elliott Wave Analysis Trading Lounge Weekly Chart,
NIKKEI 225(N225) Elliott Wave Technical Analysis
FUNCTION: Trend
MODE: corrective
STRUCTURE: blue wave 4
POSITION: black wave 3
DIRECTION NEXT HIGHER DEGREES: blue wave 5
DETAILS: Blue Wave 3 looking completed at 41215, now Blue Wave 4 is in play. Wave Cancel invalid level: 88686
The weekly chart analysis of the NIKKEI 225 (N225) provides insights into the Elliott Wave pattern governing the price movements of this prominent Japanese stock market index, focusing on potential trends and corrective phases.
Function:
The analysis identifies the function as "Trend," suggesting that the NIKKEI 225 is currently exhibiting characteristics indicative of a broader trend direction. This implies that the market may be in a phase of sustained movement in a particular direction.
Mode:
The mode specified in the analysis is "corrective," indicating that the current price action is part of a corrective phase within the Elliott Wave sequence. This suggests that the ongoing movement is not indicative of a new impulse wave but rather a temporary interruption in the prevailing trend.
Structure:
The structure highlighted is "blue wave 4," representing the specific wave count within the corrective phase. This implies that the NIKKEI 225 is currently undergoing a corrective wave labeled as "blue wave 4," which is part of a broader corrective pattern.
Position:
The position identified is "black wave 3," specifying the location of the current wave within the broader Elliott Wave pattern. This suggests that the market is advancing within the "black wave 3" phase of the corrective wave cycle.
Direction for Next Higher Degrees:
The analysis indicates the direction for the next higher degrees as "blue wave 5," implying the potential continuation of the corrective wave cycle at a broader degree. This suggests that the current corrective movement may precede another impulse wave within the broader trend.
Details:
The analysis notes that "blue wave 3" is presumed to have completed at 41215, indicating the onset of "blue wave 4." This suggests that the NIKKEI 225 may experience further corrective movement in the coming weeks. The wave cancellation or invalidation level is set at 88686, serving as a crucial threshold for evaluating the validity of the current wave count.
In summary, the weekly chart analysis of the NIKKEI 225 suggests that the index is currently in a corrective phase within the broader trend. The identified wave counts and structural analysis offer valuable insights for traders seeking to understand and navigate the market dynamics of the NIKKEI 225.
Technical Analyst: Malik Awais
Source: visit Tradinglounge.com and learn From the Experts Join TradingLounge Here
See previous: NASDAQ Composite Elliott Wave Analysis
Special Trial Offer - 0.76 Cents a Day for 3 Months! Click here
Access 7 Analysts Over 170 Markets Covered. Chat Room With Support