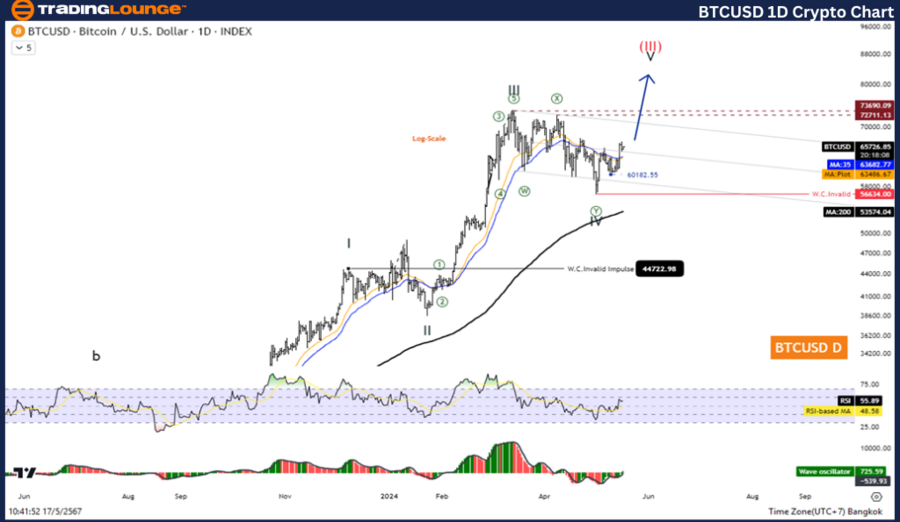
BTCUSD Elliott Wave Analysis TradingLounge Daily Chart

Bitcoin/ U.S. Dollar (BTCUSD) Daily Chart Analysis

BTCUSD Elliott Wave Technical Analysis

  • Function: Counter Trend
  • Mode: Corrective
  • Structure: Flat
  • Position: Wave ((C))
  • Next Higher Degree Direction: Wave (III)
  • Wave Cancel Invalid Level: 31046.25

Details: Wave IV may be complete, and the price is likely to increase again in Wave V.

Bitcoin/ U.S. Dollar (BTCUSD) Trading Strategy:

Bitcoin remains in an uptrend, currently undergoing a correction in the fourth wave, which appears to be complete. This situation presents an opportunity to rejoin the trend. Look for opportunities to open long positions.

Bitcoin/ U.S. Dollar (BTCUSD) Technical Indicators:

  • MA200: The price is above the 200-day moving average, indicating an uptrend.
  • Wave Oscillator: Showing bullish momentum.

Bitcoin (BTCUSD) is in a corrective phase, specifically in a flat structure, positioned in Wave ((C)). This correction is part of a larger uptrend, with the next higher degree pointing towards Wave (III). The invalidation level for this wave count is 31046.25, meaning that if the price drops below this level, the current wave analysis would be invalidated. As Wave IV appears to be complete, there is an expectation of a price increase as the market moves into Wave V.

BTCUSD-1D-Crypto-Cha...


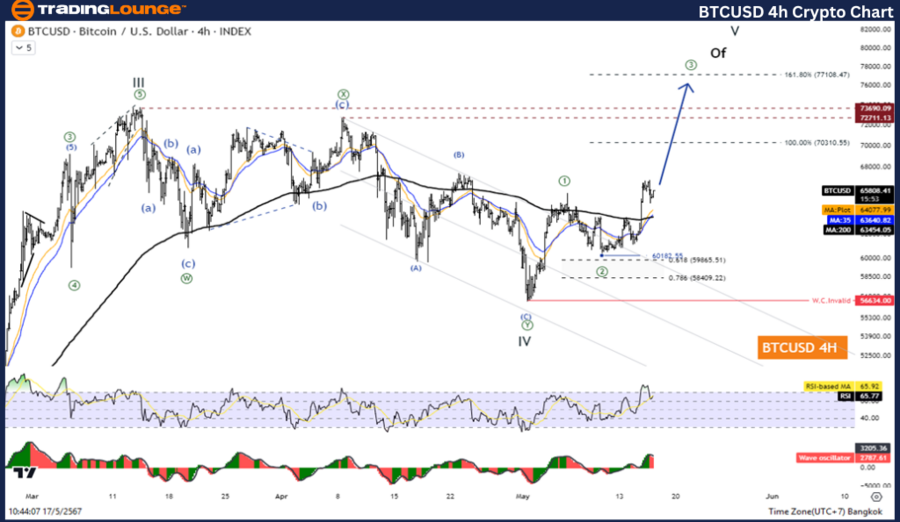
BTCUSD Elliott Wave Analysis TradingLounge H4 Chart

Bitcoin/ U.S. Dollar (BTCUSD) 4-hour Chart Analysis

BTCUSD Elliott Wave Technical Analysis

  • Function: Counter Trend
  • Mode: Corrective
  • Structure: Flat
  • Position: Wave C
  • Next Higher Degree Direction: Wave (2)
  • Wave Cancel Invalid Level: 59835.83

Details: Wave (2) is equal to 61.8% of Wave (1) at 61903.07.

Bitcoin/ U.S. Dollar (BTCUSD) Trading Strategy:

Overall, Bitcoin remains in an uptrend despite undergoing a correction in the fourth wave, which now seems complete. This provides an opportunity to rejoin the trend. Look for long position opportunities.

Bitcoin/ U.S. Dollar (BTCUSD) Technical Indicators:

  • MA200: The price is above the 200-day moving average, signalling an uptrend.
  • Wave Oscillator: Indicating bullish momentum.

On the 4-hour chart, Bitcoin is also in a corrective phase, positioned in Wave C within a flat structure. The current analysis suggests that Wave (2) has retraced 61.8% of Wave (1), with the critical level for invalidation set at 59835.83. This wave count indicates a corrective move that aligns with the broader uptrend seen in the daily chart.

Technical Analyst: Kittiampon Somboonsod

Source: visit Tradinglounge.com and learn From the Experts Join TradingLounge Here 

See Previous: VeChain (VETUSD) Elliott Wave Technical Analysis

Special Trial Offer - 0.76 Cents a Day for 3 Months! Click here

Access 7 Analysts Over 170 Markets Covered. Chat Room With Support

BTCUSD-4H-Crypto-Cha...

Related

Gold (XAUUSD) Elliott Wave Technical Analysis: Commodity Market Forecast, Trading Strategy, and Price Prediction

Gold (XAUUSD) Elliott Wave Technical Analysis: Commodity Market Forecast, Trading Strategy, and Price Prediction

This article provides an in-depth Elliott Wave analysis of gold, covering the latest price forecast,...

Read More >
Comprehensive British Pound/U.S.Dollar (GBPUSD) Forex Elliott Wave Technical Analysis

Comprehensive British Pound/U.S.Dollar (GBPUSD) Forex Elliott Wave Technical Analysis

Dive into our comprehensive GBPUSD Elliott Wave analysis to understand the future price movements of...

Read More >
Watch The Ongoing Developments in Hero MotoCorp’s Share Price: HERO Stocks Elliott Wave Technical Analysis

Watch The Ongoing Developments in Hero MotoCorp’s Share Price: HERO Stocks Elliott Wave Technical Analysis

Explore the latest Hero MotoCorp stock analysis using Elliott Wave theory and technical indicators. ...

Read More >
Make Informed Trading Decisions with Todays Bitcoin Crypto Price News and BTCUSD Elliott Wave Technical Analysis

Make Informed Trading Decisions with Todays Bitcoin Crypto Price News and BTCUSD Elliott Wave Technical Analysis

Explore the BTCUSD Elliott Wave Analysis to gain insights into Bitcoin's market movements. This ...

Read More >
Comprehensive Commodity Market Elliott Wave Analysis: Trends in Bitcoin, Bonds, Yields, USD, Gold, Silver, Copper, and More

Comprehensive Commodity Market Elliott Wave Analysis: Trends in Bitcoin, Bonds, Yields, USD, Gold, Silver, Copper, and More

Discover the latest trends in commodity markets with our detailed Elliott Wave analysis. This update...

Read More >
WESTPAC BANKING CORPORATION- Learn how to leverage these WBC Stock Analysis & Elliott Wave Technical Forecast

WESTPAC BANKING CORPORATION- Learn how to leverage these WBC Stock Analysis & Elliott Wave Technical Forecast

Explore the comprehensive Elliott Wave analysis for ASX: WESTPAC BANKING CORPORATION (WBC). Our deta...

Read More >

Buy 1 Month

Get 3 Months!

Special Offer:

Trade Recommendations

Unleash the power of deversified trading with our comprehensive portfolio, covering:

  • Stock Trades
  • Crypto Trades
  • Forex Trades
  • Commodity Trades
Elliott Wave Analysis

Gain a competive edge with expert insights in to:

  • Global Indices
  • US Stocks & ASX Stocks
  • Forex & Crypto
  • Commodities
Top-Notch Trading Tools

Equip yourself with the tools of success:

  • Social Chat
  • Elliott Wave Algorithm
  • Screener
  • TradingLevels
  • Trading Game
7 Elliott Wave Analysts

Stay ahead of the market with daily charts and insightful videos
-Your secret to strategic trading!

JOIN HERE


Welcome to TradingLounge (ASIC A.R.No. 321187), specialists in trades, trading education and technical analysis, covering stocks, indices, commodities, forex and cryptocurrencies.

When you join TradingLounge you have access to everything we offer, including trade tools, educational content and a social platform to chat with like-minded investors.

Read more

@Copyright 2024 by tradinglounge.com

Contact Us

Australian no: 02 4787 6020

International no: +61 (2) 47876020

Pay with:

Find us on