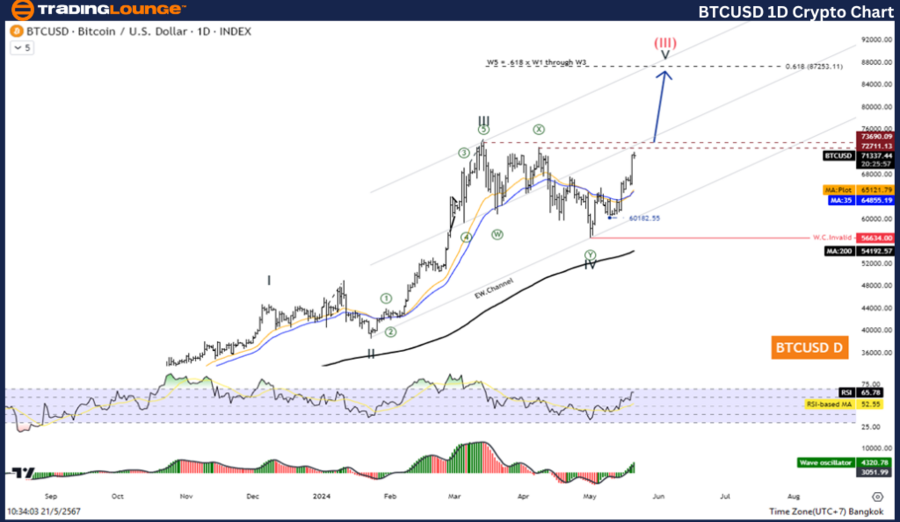
BTCUSD Elliott Wave Analysis TradingLounge Daily Chart

Bitcoin/ U.S. Dollar (BTCUSD) Crypto Chart

BTCUSD Elliott Wave Technical Analysis

Function: Follow Trend

Mode: Motive

Structure: Impulse

Position: Wave V

Direction Next Higher Degrees: Wave (III)

Wave Cancel Invalid Level: 31046.25

Details: Wave IV may be complete, and the price could increase again in Wave V.

Bitcoin/ U.S. Dollar (BTCUSD) Trading Strategy:

Overall, Bitcoin remains in an uptrend. The current period reflects a correction in the fourth wave, which seems to be complete. Therefore, this presents an opportunity to rejoin the trend. Look for chances to open long positions.

Bitcoin/ U.S. Dollar (BTCUSD) Technical Indicators:

  • The price is above the MA200, indicating an uptrend.
  • The Wave Oscillator shows bullish momentum.

On the daily chart, Bitcoin is exhibiting an impulse wave pattern, currently in Wave V. This suggests a continuation of the uptrend, following the completion of Wave IV. The price action is supportive of this analysis, as Bitcoin is trading above the 200-day moving average (MA200), a classic indicator of bullish momentum.

BTCUSD-1D-Crypto-Cha...


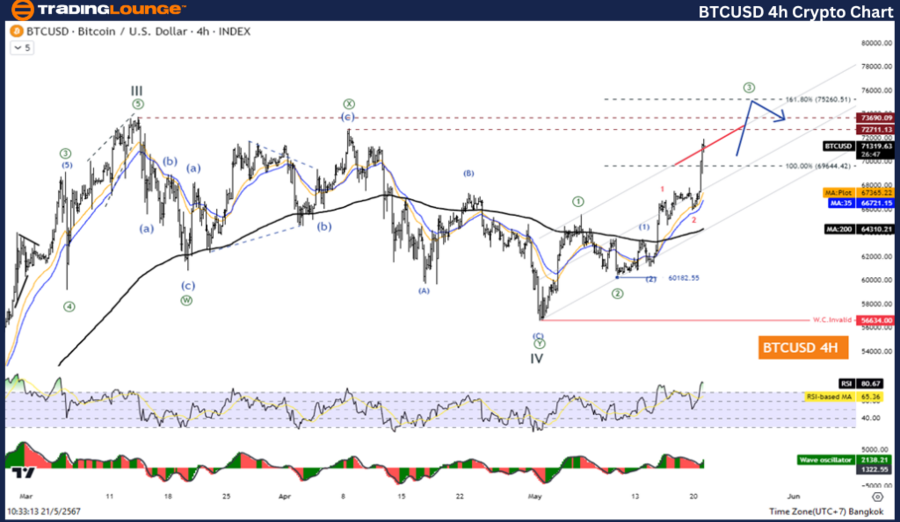
BTCUSD Elliott Wave Analysis TradingLounge H4 Chart

Bitcoin/ U.S. Dollar (BTCUSD) Crypto Analysis

BTCUSD Elliott Wave Technical Analysis

Function: Follow Trend

Mode: Motive

Structure: Impulse

Position: Wave V

Direction Next Higher Degrees: Wave (III)

Wave Cancel Invalid Level: 31046.25

Details: Wave IV may be complete, and the price could increase again in Wave V.

Bitcoin/ U.S. Dollar (BTCUSD) Trading Strategy:

Overall, Bitcoin remains in an uptrend. The current period reflects a correction in the fourth wave, which seems to be complete. Therefore, this presents an opportunity to rejoin the trend. Look for chances to open long positions.

Bitcoin/ U.S. Dollar (BTCUSD) Technical Indicators:

  • The price is above the MA200, indicating an uptrend.
  • The Wave Oscillator shows bullish momentum.

The H4 chart analysis corroborates the findings on the daily chart, with Bitcoin in Wave V of an impulse wave. Similar to the daily chart, the H4 chart's price action suggests the completion of Wave IV and the onset of Wave V.

Technical Analyst: Kittiampon Somboonsod

Source: visit Tradinglounge.com and learn From the Experts Join TradingLounge Here 

See Previous: Bitcoin/ U.S. Dollar (BTCUSD) Elliott Wave Technical Analysis

Special Trial Offer - 0.76 Cents a Day for 3 Months! Click here

Access 7 Analysts Over 170 Markets Covered. Chat Room With Support

BTCUSD-4H-Crypto-Cha...

Related

Exxon Mobil Corp.(XOM:NYSE) Elliott Wave Technical Analysis

Exxon Mobil Corp.(XOM:NYSE) Elliott Wave Technical Analysis

Exxon Mobil Corp.(XOM:NYSE) Elliott Wave Technical Analysis  looking for longs after upside confirma...

Read More >
BTCUSD Elliott Wave Technical Analysis to Understand Bitcoin’s Current Price Action and BTC Forecast News Today

BTCUSD Elliott Wave Technical Analysis to Understand Bitcoin’s Current Price Action and BTC Forecast News Today

Dive into an in-depth BTCUSD Elliott Wave analysis to understand Bitcoin’s current price action and...

Read More >
Salesforce Inc.(CRM) Stocks Elliott Wave Analysis - Stock Movements and Forecast with this in-depth Technical Analysis

Salesforce Inc.(CRM) Stocks Elliott Wave Analysis - Stock Movements and Forecast with this in-depth Technical Analysis

This Salesforce (CRM) stock analysis applies the Elliott Wave Theory to both daily and 1-hour charts...

Read More >
Master Euro Stoxx 50 Trading: Expert Euro Stoxx 50 Index Elliott Wave Technical Analysis, Top Stock Picks & Winning Strategies

Master Euro Stoxx 50 Trading: Expert Euro Stoxx 50 Index Elliott Wave Technical Analysis, Top Stock Picks & Winning Strategies

This article provides a detailed Elliott Wave analysis of the Euro Stoxx 50, offering valuable insig...

Read More >
Soybeans Commodity Elliott Wave Technical Analysis: Detailing the Market Trends, and Price Forecasts

Soybeans Commodity Elliott Wave Technical Analysis: Detailing the Market Trends, and Price Forecasts

This article provides a comprehensive Elliott Wave Analysis for soybeans, detailing the market trend...

Read More >
Unlocking ASX Trading Success: Origin Energy Limited – ORG Stock Analysis & Elliott Wave Technical Forecast

Unlocking ASX Trading Success: Origin Energy Limited – ORG Stock Analysis & Elliott Wave Technical Forecast

This article provides an in-depth Elliott Wave analysis for Origin Energy (ASX: ORG), covering curre...

Read More >

Buy 1 Month

Get 3 Months!

Special Offer:

Trade Recommendations

Unleash the power of deversified trading with our comprehensive portfolio, covering:

  • Stock Trades
  • Crypto Trades
  • Forex Trades
  • Commodity Trades
Elliott Wave Analysis

Gain a competive edge with expert insights in to:

  • Global Indices
  • US Stocks & ASX Stocks
  • Forex & Crypto
  • Commodities
Top-Notch Trading Tools

Equip yourself with the tools of success:

  • Social Chat
  • Elliott Wave Algorithm
  • Screener
  • TradingLevels
  • Trading Game
7 Elliott Wave Analysts

Stay ahead of the market with daily charts and insightful videos
-Your secret to strategic trading!

JOIN HERE


Welcome to TradingLounge (ASIC A.R.No. 321187), specialists in trades, trading education and technical analysis, covering stocks, indices, commodities, forex and cryptocurrencies.

When you join TradingLounge you have access to everything we offer, including trade tools, educational content and a social platform to chat with like-minded investors.

Read more

@Copyright 2024 by tradinglounge.com

Contact Us

Australian no: 02 4787 6020

International no: +61 (2) 47876020

Pay with:

Find us on