Iron Ore Elliott Wave Analysis Index Futures Overview
Iron Ore Elliott Wave Technical Analysis
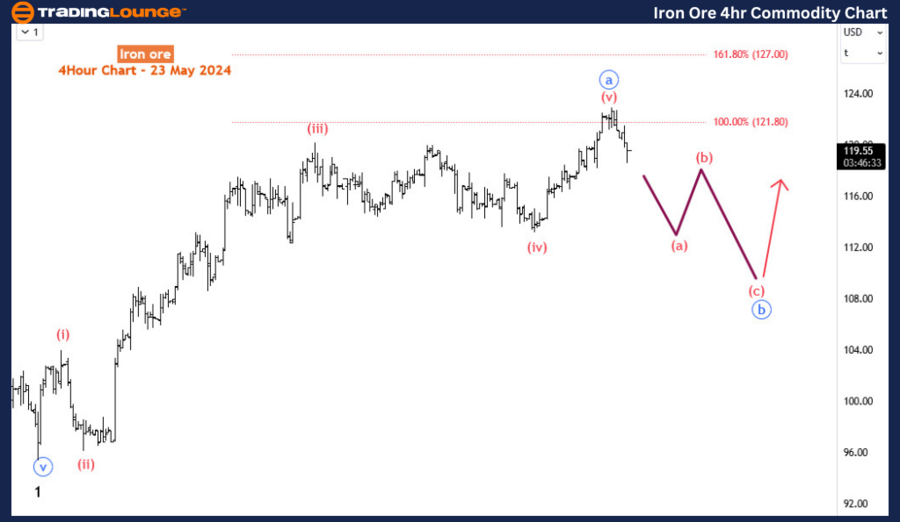
Function: Counter-trend
Mode: Corrective for Wave 2
Structure: Impulse for Blue Wave ‘a’
Position: Blue Wave ‘a’
Direction: Blue Wave ‘b’
Details: The price is turning downside off the reversal zone, indicating that blue wave ‘b’ may have started. However, there is still a possibility that wave (v) of blue wave ‘a’ might return upside and move higher into the zone. We will wait for the completion of blue wave ‘b’ before going LONG.
SGX TSI Iron Ore Index Futures Overview
The SGX TSI Iron Ore Index Futures is a financial derivative traded on the Singapore Exchange (SGX). It is used to hedge or speculate on the price movements of iron ore, a crucial raw material in steel production.
FEF! has been recovering since late March 2024, gaining over 24% during this period. This bounce is completing an impulse wave, suggesting a high likelihood of an extension to the upside in the medium term. However, the long-term trend appears bearish. Thus, after the corrective recovery concludes, sellers are likely to regain control.
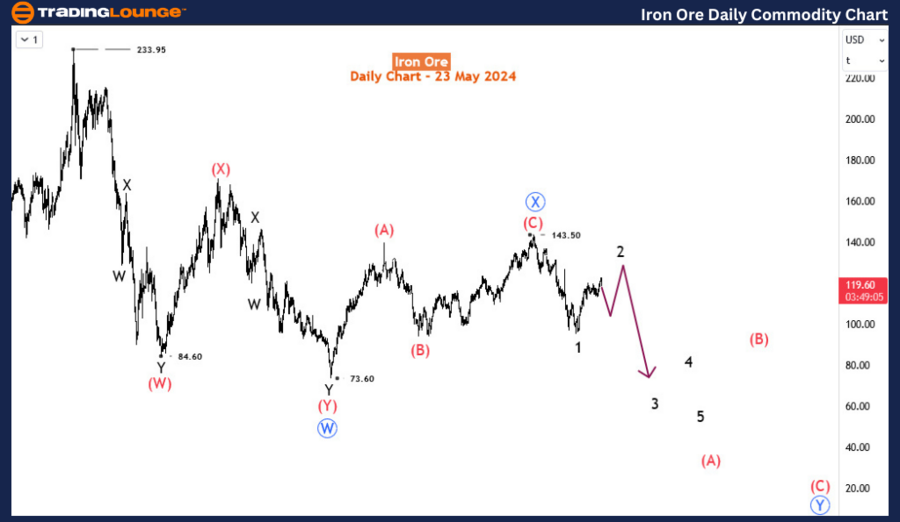
Daily Chart Analysis
The medium-term trend on the daily chart is somewhat sideways, but the trend from May 2021 is bearish. The bearish trend started at 233.95 in May 2021 and completed a double zigzag corrective structure in October 2022 at 73.6. The price then formed another zigzag structure, ending at 143.5 in January 2024. This indicates a primary degree double zigzag from the top of 233.95. Primary degree wave ‘X’ (circled) ended at 143.5, and the corresponding primary degree wave ‘Y’ has now begun. We could either see an A-B-C structure or a W-X-Y for primary degree blue wave B. Currently, the price is correcting the first decline from 143.5, meaning that once the correction is over, bears should take control again, driving prices below 73.6.
H4 Chart Analysis
On the H4 chart, we analyze the current bullish correction - wave 2. Wave 2 is close to completing an impulse wave, which should be its first leg - blue wave ‘a’. After blue wave ‘a’, a corrective pullback for blue wave ‘b’ is expected, which should complete above the low of wave 1 at 95.4. Following this, wave 2 should resume higher in blue wave ‘c’. Buyers will have another opportunity to advance the recovery after finding common support for blue wave ‘b’, leading to blue wave ‘c’. However, the recovery is expected to be limited before sellers take over for wave 3 after wave 2 finds a common resistance area.
Technical Analyst: Sanmi Adeagbo
Source: visit Tradinglounge.com and learn From the Experts Join TradingLounge Here
See Previous: Silver Commodity Elliott Wave Analysis
Special Trial Offer - 0.76 Cents a Day for 3 Months! Click here
Access 7 Analysts Over 170 Markets Covered. Chat Room With Support