TradingLounge Elliott Wave Analysis for ChainLink (LINKUSD)
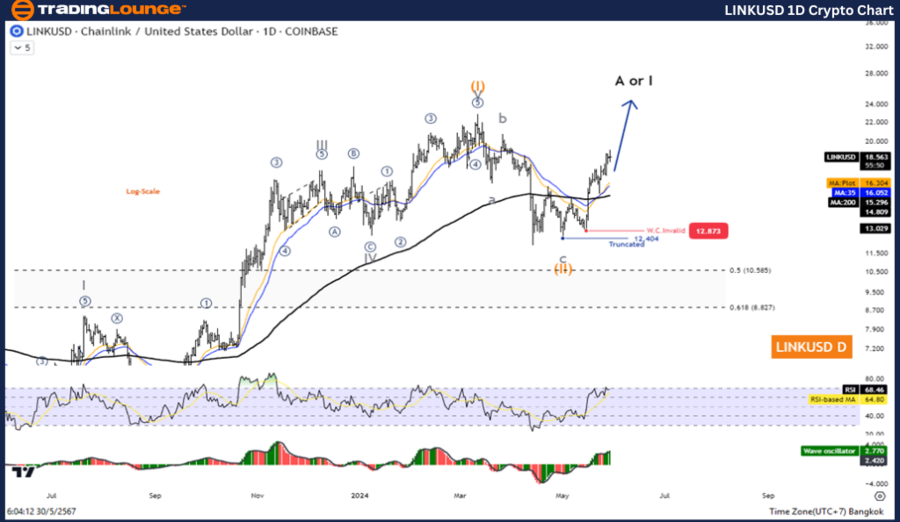
Daily Chart Analysis for LINKUSD
LINKUSD Elliott Wave Technical Analysis
Function: Counter Trend
Mode: Corrective
Structure: Zigzag
Position: Wave C
Next Higher Degrees: Wave (I) of Impulse
Wave Cancel Invalid Level: 8.498
Details: Wave C may be complete, suggesting a potential price increase in Wave A or I.
Trading Strategy for ChainLink/USD (LINKUSD)
The correction wave (II) appears to be over, indicating a price rise in wave (III). Focus on the five-wave increase in the Impulse pattern, which is expected to stay above the 24.00 level.
Technical Indicators for LINKUSD
The price is above the MA200, indicating an uptrend. The Wave Oscillator shows bullish momentum.
Daily Chart Analysis Highlights
On the daily chart, LINKUSD is in a counter-trend corrective phase, currently in Wave C of a Zigzag pattern. The key level to watch is 8.498. If the price remains above this level, it indicates that Wave C may be complete, suggesting a potential rise in Wave A or I.
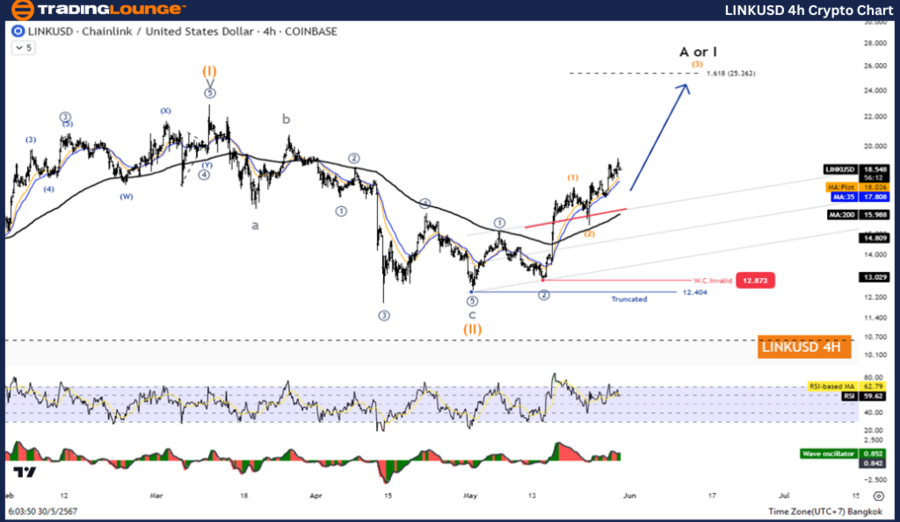
LINKUSD Elliott Wave Analysis TradingLounge H4 Chart,
H4 Chart Analysis for LINKUSD
LINKUSD Elliott Wave Technical Analysis
Function: Counter Trend
Mode: Corrective
Structure: Zigzag
Position: Wave C
Next Higher Degrees: Wave (I) of Impulse
Wave Cancel Invalid Level: 8.498
Details: Wave C may be complete, suggesting a potential price increase in Wave A or I.
Trading Strategy for ChainLink/USD (LINKUSD)
The correction wave (II) appears to be over, indicating a price rise in wave (III). Focus on the five-wave increase in the Impulse pattern, which is expected to stay above the 24.00 level.
Technical Indicators for LINKUSD
The price is above the MA200, indicating an uptrend. The Wave Oscillator shows bullish momentum.
H4 Chart Analysis Highlights
The H4 chart reinforces the daily chart analysis. The corrective wave (II) appears to be complete, signaling the start of wave (III). This is an impulsive wave, typically characterized by strong upward momentum. The target for this wave is above the 24.00 level, indicating a significant upside potential.
Technical Analyst: Kittiampon Somboonsod
Source: visit Tradinglounge.com and learn From the Experts Join TradingLounge Here
See Previous: Polkadot Crypto Elliott Wave Technical Analysis
Special Trial Offer - 0.76 Cents a Day for 3 Months! Click here
Access 7 Analysts Over 170 Markets Covered. Chat Room With Support
Conclusion: Optimizing Your Trading Approach with Elliott Wave Analysis
Elliott Wave Analysis provides valuable insights into market trends, helping traders make informed decisions. For ChainLink (LINKUSD), the analysis indicates a potential bullish phase, with key levels and indicators supporting this view. By focusing on the identified patterns and maintaining disciplined risk management, traders can optimize their trading strategies.