Welcome to our latest Elliott Wave analysis for Exxon Mobil Inc. (XOM) as of June 10, 2024. This comprehensive analysis delves into XOM's price movements using Elliott Wave Theory, guiding traders in identifying potential opportunities based on current trends and market structure. We will provide insights from both the daily and 4-hour charts to offer a thorough perspective on XOM's market behaviour.

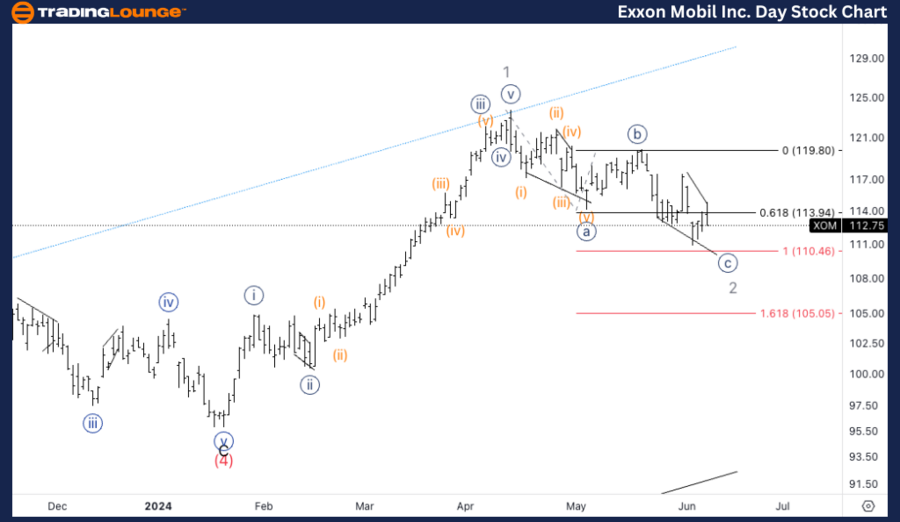
XOM Elliott Wave Analysis - Trading Lounge Daily Chart

Exxon Mobil Inc. Stock Daily Chart Analysis

FUNCTION: Counter Trend

MODE: Corrective

STRUCTURE: Zigzag

POSITION: Wave 2

DIRECTION: Bottom in Wave 2

DETAILS: Anticipating a pullback in minor wave 2 of (5), with the possibility that wave (5) has already topped.

XOM Elliott Wave Technical Analysis

In our Elliott Wave analysis of Exxon Mobil Inc. (XOM), we identify a counter-trend corrective pattern marked by a Zigzag structure. XOM is currently in Wave 2, indicating a bottom in this corrective phase. We expect a pullback in minor wave 2 of (5), suggesting wave (5) may have already peaked. Traders should watch for signs of a completed correction and the beginning of a new upward move. The key support level of around $110 will be crucial for confirming the end of this corrective wave and the resumption of the primary trend.

Exxon-Mobil-Inc-Day-...


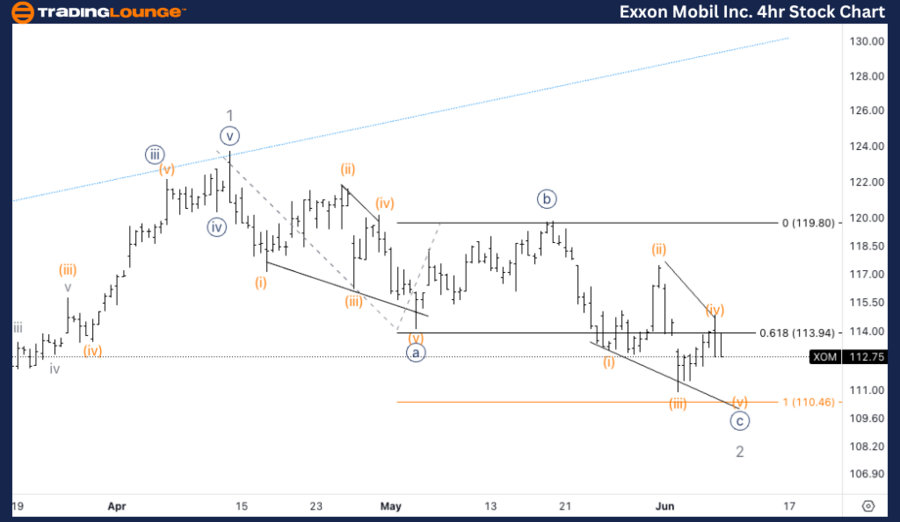
XOM Elliott Wave Analysis - Trading Lounge 4Hr Chart

Exxon Mobil Inc. (XOM) 4Hr Chart Analysis

Technical Elliott Wave Analysis of XOM Stock

FUNCTION: Counter Trend

MODE: Corrective

STRUCTURE: Zigzag

POSITION: Wave {c} of 2

DIRECTION: Downside in Wave {c}

DETAILS: Zooming into wave 2, we observe a potential rare event with both a leading diagonal in wave {a} and an ending diagonal in wave {c}. We anticipate a bounce at the equality of {c} vs. {a} around $110.

Elliott Wave Analysis of XOM

On the 4-hour chart, XOM shows a counter-trend corrective mode within a Zigzag structure, specifically in wave {c} of 2. The analysis reveals that wave 2 features a rare scenario with both a leading diagonal in wave {a} and an ending diagonal in wave {c}. We expect a bounce at the equality of {c} vs. {a} around the $110 level. If this level holds, it could indicate the completion of wave {c} and the end of the corrective phase, offering a potential entry point for traders aiming to capitalize on a bullish reversal.

Technical Analyst: Alessio Barretta

Source: visit Tradinglounge.com and learn From the Experts Join TradingLounge Here 

See Previous: JPMorgan Chase & Co. (JPM) Elliott Wave Technical Analysis

Special Trial Offer - 0.76 Cents a Day for 3 Months! Click here

Access 7 Analysts Over 170 Markets Covered. Chat Room With Support

Exxon-Mobil-Inc-4Hr-...

Related

Meta Platforms Inc.(META:NASDAQ) Elliott Wave Technical Analysis 26 October 23

Meta Platforms Inc.(META:NASDAQ) Elliott Wave Technical Analysis 26 October 23

Meta Platforms Inc.(META:NASDAQ) Elliott Wave Technical Analysis 26 October 23, Stock Analysis for t...

Read More >
Unlocking Profit Potential with Elliott Wave Analysis for Binance Coin (BNBUSD) Trading - 13th February 2024

Unlocking Profit Potential with Elliott Wave Analysis for Binance Coin (BNBUSD) Trading - 13th February 2024

The February 13, 2024, Binance Coin (BNBUSD) Elliott Wave Analysis, explores cryptocurrency market t...

Read More >
in-depth Analysis and Trading Strategies S&P/ASX 200 Indices Elliott Wave Technical Analysis

in-depth Analysis and Trading Strategies S&P/ASX 200 Indices Elliott Wave Technical Analysis

Stay ahead in the S&P/ASX 200 market with our in-depth analysis and trading strategies. Our comprehe...

Read More >
Unraveling Euro/U.S.Dollar(EURUSD)  Forex : An In-depth Elliott Wave Technical Forecast and Trading Strategy Analysis

Unraveling Euro/U.S.Dollar(EURUSD)  Forex : An In-depth Elliott Wave Technical Forecast and Trading Strategy Analysis

This article provides an in-depth Elliott Wave Analysis of the EURUSD currency pair, highlighting ke...

Read More >
U.S.Dollar/Canadian Dollar(USD/CAD) Elliott Wave Technical Analysis 24 October 23

U.S.Dollar/Canadian Dollar(USD/CAD) Elliott Wave Technical Analysis 24 October 23

In summary, the USD/CAD Elliott Wave Analysis for 24 October 23, is significant for traders seeking ...

Read More >
Maximize Your Returns: In-Depth Apple (AAPL) Stock Analysis & 2024 Elliott Wave Forecast

Maximize Your Returns: In-Depth Apple (AAPL) Stock Analysis & 2024 Elliott Wave Forecast

Stay ahead in your trading game with our comprehensive Elliott Wave analysis of Apple Inc. (AAPL). T...

Read More >

Buy 1 Month

Get 3 Months!

Special Offer:

Trade Recommendations

Unleash the power of deversified trading with our comprehensive portfolio, covering:

  • Stock Trades
  • Crypto Trades
  • Forex Trades
  • Commodity Trades
Elliott Wave Analysis

Gain a competive edge with expert insights in to:

  • Global Indices
  • US Stocks & ASX Stocks
  • Forex & Crypto
  • Commodities
Top-Notch Trading Tools

Equip yourself with the tools of success:

  • Social Chat
  • Elliott Wave Algorithm
  • Screener
  • TradingLevels
  • Trading Game
7 Elliott Wave Analysts

Stay ahead of the market with daily charts and insightful videos
-Your secret to strategic trading!

JOIN HERE


Welcome to TradingLounge (ASIC A.R.No. 321187), specialists in trades, trading education and technical analysis, covering stocks, indices, commodities, forex and cryptocurrencies.

When you join TradingLounge you have access to everything we offer, including trade tools, educational content and a social platform to chat with like-minded investors.

Read more

@Copyright 2024 by tradinglounge.com

Contact Us

Australian no: 02 4787 6020

International no: +61 (2) 47876020

Pay with:

Find us on