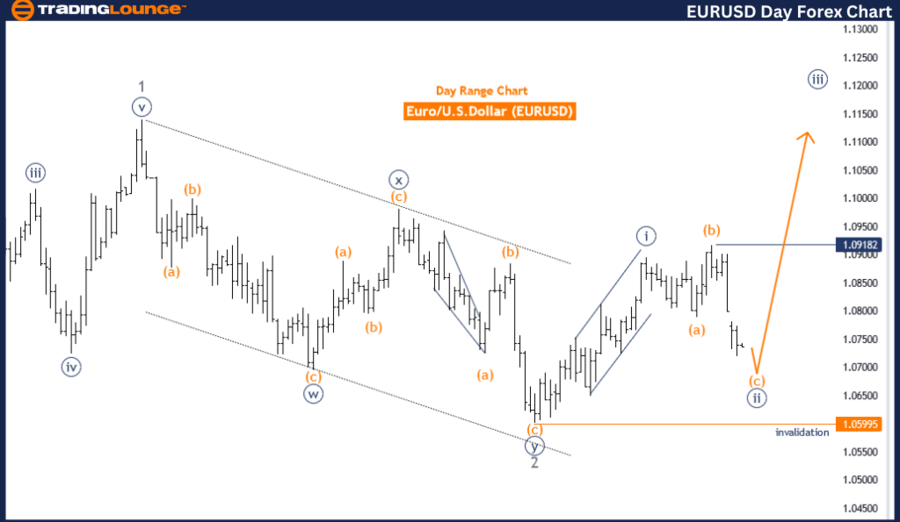
EURUSD Elliott Wave Analysis Trading Lounge Day Chart
Euro/U.S.Dollar (EURUSD) Day Chart
EURUSD Elliott Wave Technical Analysis
FUNCTION: Counter Trend
MODE: Corrective
STRUCTURE: Orange Wave C
POSITION: Navy Blue Wave 2
DIRECTION NEXT HIGHER DEGREES: Navy Blue Wave 3
DETAILS: Orange wave C of 2 still in play. After that, Navy Blue Wave 3 will start.
Wave cancel invalid level: 1.05995.
The EURUSD Elliott Wave analysis on the daily chart focuses on a counter-trend move within a corrective wave pattern identified as orange wave C. The current wave structure is positioned as navy blue wave 2, suggesting the market is experiencing a correction within a larger trend. This analysis indicates that orange wave C is still ongoing and is part of the larger corrective phase of navy blue wave 2.
The primary function of this analysis is to monitor the counter-trend movements in the EURUSD market. The wave mode is corrective, falling within wave C, which typically marks the final leg of a correction. The wave structure labeled as orange wave C implies that the market is nearing the completion of its correction phase.
The position of navy blue wave 2 indicates that the market is in the corrective phase of a larger trend. This phase is a precursor to the next significant movement, which will be navy blue wave 3. The direction for the next higher degrees is identified as the beginning of navy blue wave 3, signifying a transition from the corrective phase to a new impulsive trend.
The analysis details suggest that orange wave C of navy blue wave 2 is still in progress. This means the market is finalizing its correction before moving into the next impulsive phase. Once orange wave C completes, navy blue wave 3 is expected to begin, marking the start of a new upward trend in the market.
A critical aspect of this analysis is the wave cancel invalid level, set at 1.05995. This level is essential for maintaining the validity of the current wave structure. If the market price falls below this level, it would invalidate the existing wave count, necessitating a reassessment of the Elliott Wave analysis and potentially changing the expected market direction.
In summary, the EURUSD daily chart analysis reveals that the market is in the final stages of a corrective phase within navy blue wave 2. The completion of orange wave C will initiate navy blue wave 3, signaling the start of a new upward trend. The wave cancel invalid level at 1.05995 is crucial for confirming the current wave count and guiding future market expectations based on the Elliott Wave principles.
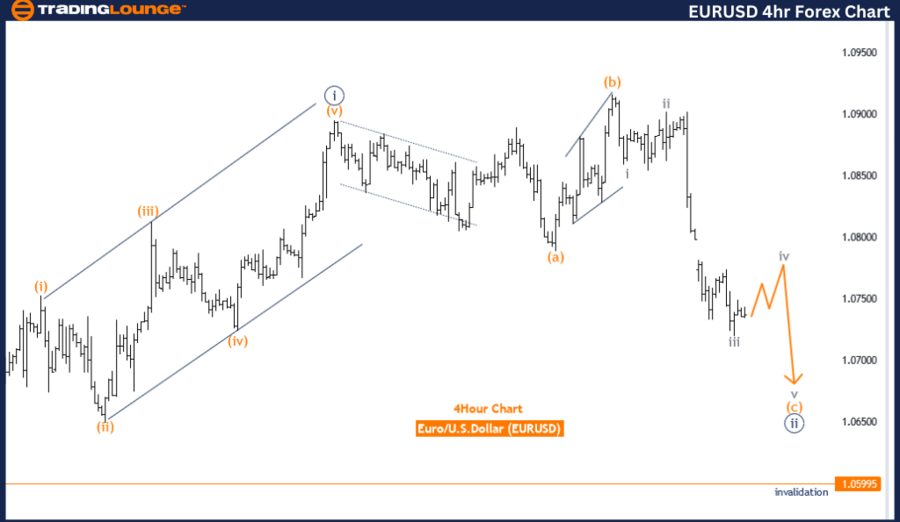
EURUSD Elliott Wave Analysis Trading Lounge 4-Hour Chart
Euro/U.S.Dollar (EURUSD) 4 Hour Chart Analysis
EURUSD Elliott Wave Technical Analysis
FUNCTION: Counter Trend
MODE: Impulsive as C
STRUCTURE: Orange Wave C
POSITION: Navy Blue Wave 2
DIRECTION NEXT HIGHER DEGREES: Navy Blue Wave 3
DETAILS: Orange wave C of 2 still in play. After that, Navy Blue Wave 3 will start.
Wave cancel invalid level: 1.05995.
The EURUSD Elliott Wave analysis on the 4-hour chart indicates a counter-trend move within an impulsive wave pattern classified as orange wave C. The current wave structure is positioned as navy blue wave 2, suggesting that the market is undergoing a correction within a larger trend. This analysis highlights that orange wave C is still in progress and is part of the larger corrective phase of navy blue wave 2.
The primary function of this analysis is to track the counter-trend movements in the EURUSD market. The mode of this wave is impulsive as it falls within wave C, which typically signifies a strong directional move that completes a corrective pattern. The wave structure identified as orange wave C implies that the market is nearing the end of the correction phase.
Navy blue wave 2 is the current position, indicating that the market is in the corrective phase of a larger trend. This wave is part of the preparation for the next significant movement, which will be navy blue wave 3. The direction for the next higher degrees is identified as the commencement of navy blue wave 3, signifying a transition from the corrective phase to a new impulsive trend.
The analysis details suggest that orange wave C of navy blue wave 2 is still in play. This indicates that the market is finalizing its correction before transitioning to the next impulsive phase. The completion of orange wave C will set the stage for the beginning of navy blue wave 3, which is expected to mark a new upward trend in the market.
A critical component of this analysis is the wave cancel invalid level, set at 1.05995. This level is vital for maintaining the validity of the current wave structure. If the market price drops below this level, it would invalidate the existing wave count, requiring a reassessment of the Elliott Wave analysis and potentially altering the expected market direction.
The EURUSD 4-hour chart analysis reveals that the market is in the final stages of a corrective phase within navy blue wave 2. The completion of orange wave C will initiate navy blue wave 3, marking the start of a new upward trend. The wave cancel invalid level at 1.05995 is crucial for confirming the current wave count and guiding future market expectations based on the Elliott Wave principles.
Technical Analyst: Malik Awais
Source: visit Tradinglounge.com and learn From the Experts Join TradingLounge Here
Previous: AUDUSD Elliott Wave Technical Analysis
Special Trial Offer - 0.76 Cents a Day for 3 Months! Click here
Access 7 Analysts Over 170 Markets Covered. Chat Room With Support