Wheat Elliott Wave Analysis

Function: Counter Trend

Mode: Corrective

Structure: Zigzag for wave (B)

Position: Wave A of (B)

Direction: Wave A is still in play

Details: Wave A of (B) is about to complete, indicating a bullish correction for wave B soon.

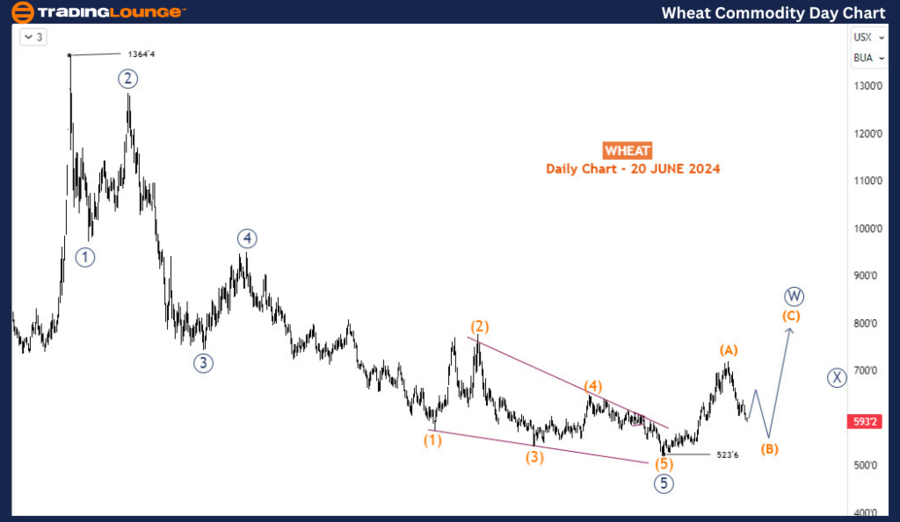
Wheat prices are currently retreating. However, as long as they do not breach the March 2024 low, there is a significant chance that the recovery from March will continue. The long-term trend remains bearish, and the current recovery phase is retracing this trend and may extend much higher.

Daily Chart Analysis

On the daily chart, the bearish trend that extended from March 2022 to March 2024 completed an impulse wave structure. From the low of 523’4 in March 2024, a bullish correction began as expected. The initial response off 523’4 completed an impulse rally, indicating that this corrective phase could evolve into either a zigzag or a double zigzag structure. Thus, we expect at least a zigzag pattern composed of waves (A), (B), and (C). The surge from the March 2024 low completed wave (A) with an impulse, and the price is now correcting this in wave (B). After the completion of wave (B), we should see another leg higher in wave (C). This is the minimum expectation for the current recovery phase in Wheat.

Wheat-Commodity-Day-...


H4 Chart Analysis

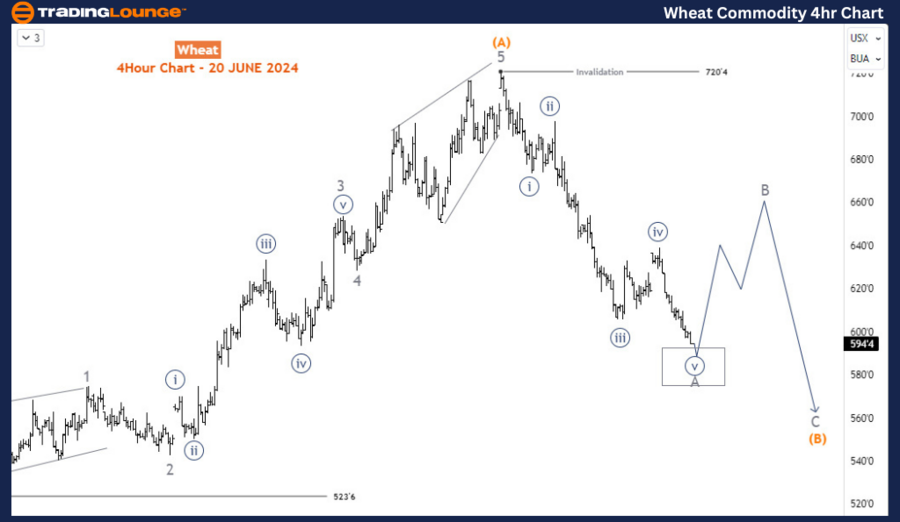
The H4 chart focuses on wave (B). The decline from the wave (A) top at 720’4 completed an impulse. A pullback for wave (B) is expected to be a corrective structure. However, the decline so far has completed an impulse wave, which could now be labeled as wave A of (B). This suggests that wave (B) should continue its formation in the near term. It is likely that wave (B) will take the form of another zigzag pattern (A-B-C), as long as the 523’6 low is not breached. If this level is breached, it would imply that the long-term bullish correction has either completed very shallowly, or a more complex scenario must be considered to better understand the situation.

Technical Analyst: Sanmi Adeagbo

Source: visit Tradinglounge.com and learn From the Experts Join TradingLounge Here 

See Previous: Copper Elliott Wave Analysis

Special Trial Offer - 0.76 Cents a Day for 3 Months! Click here

Access 7 Analysts Over 170 Markets Covered. Chat Room With Support

Wheat-Commodity-4h-C...

Summary

Wheat prices are retreating, but as long as the March 2024 low of 523’4 remains intact, the recovery from March is likely to continue. The long-term trend is bearish, and the current recovery is a retracement of this trend, which may extend much higher.

  • Daily Chart: The bearish impulse wave from March 2022 to March 2024 completed at 523’4, initiating a bullish correction. The initial rally completed wave (A) with an impulse, and the price is now correcting this in wave (B). We expect at least a zigzag pattern (A-B-C) for this corrective phase.
  • H4 Chart: The decline from wave (A) at 720’4 completed an impulse, which is likely wave A of (B). Wave (B) should continue forming, likely as a zigzag pattern, as long as the 523’6 low is not breached. If the low is breached, it would indicate that the long-term bullish correction is either complete or a more complex scenario needs to be considered to accurately read the market conditions.

Related

Super Micro Computers Inc. (SMCI) Stocks Elliott Wave Technical Analysis: Stock Chart Trends, and Possible Breakouts

Super Micro Computers Inc. (SMCI) Stocks Elliott Wave Technical Analysis: Stock Chart Trends, and Possible Breakouts

This article provides a comprehensive Elliott Wave analysis of SuperMicro Computers Inc. (SMCI). It ...

Read More >
U.S. Dollar/Swiss Franc (USDCHF) Forex Elliott Wave Technical Analysis: Detailed market insights and potential price movements

U.S. Dollar/Swiss Franc (USDCHF) Forex Elliott Wave Technical Analysis: Detailed market insights and potential price movements

This article provides a comprehensive analysis of the USDCHF currency pair using Elliott Wave Theory...

Read More >
Euro/British Pound (EURGBP) Forex Elliott Wave Technical Analysis: Forecast, Bearish Trends, and Key Levels Explained

Euro/British Pound (EURGBP) Forex Elliott Wave Technical Analysis: Forecast, Bearish Trends, and Key Levels Explained

This comprehensive EURGBP Elliott Wave analysis provides insights into the ongoing bearish trend, ke...

Read More >
Watch Silver (XAGUSD) Commodity Market With Silver Elliott Wave Technical Analysis: Price Forecast and Bullish Outlook

Watch Silver (XAGUSD) Commodity Market With Silver Elliott Wave Technical Analysis: Price Forecast and Bullish Outlook

This comprehensive Silver Elliott Wave analysis provides insights into the latest market trends, pri...

Read More >
New Zealand Dollar/U.S.Dollar(NZDUSD) Elliott Wave Technical Analysis 25 January 24

New Zealand Dollar/U.S.Dollar(NZDUSD) Elliott Wave Technical Analysis 25 January 24

The NZDUSD Elliott Wave Technical Analysis for the Day and 4-hour Chart on 25 January 24, provides a...

Read More >
Commodities & Futures Market Analysis: Elliott Wave Insights & Strategies

Commodities & Futures Market Analysis: Elliott Wave Insights & Strategies

COMMODITY MARKETS: Bond Yields, USD Dollar DXY, US Gold, Silver, Iron Ore,Copper, Uranium, Oil, Gas

Read More >

Buy 1 Month

Get 3 Months!

Special Offer:

Trade Recommendations

Unleash the power of deversified trading with our comprehensive portfolio, covering:

  • Stock Trades
  • Crypto Trades
  • Forex Trades
  • Commodity Trades
Elliott Wave Analysis

Gain a competive edge with expert insights in to:

  • Global Indices
  • US Stocks & ASX Stocks
  • Forex & Crypto
  • Commodities
Top-Notch Trading Tools

Equip yourself with the tools of success:

  • Social Chat
  • Elliott Wave Algorithm
  • Screener
  • TradingLevels
  • Trading Game
7 Elliott Wave Analysts

Stay ahead of the market with daily charts and insightful videos
-Your secret to strategic trading!

JOIN HERE


Welcome to TradingLounge (ASIC A.R.No. 321187), specialists in trades, trading education and technical analysis, covering stocks, indices, commodities, forex and cryptocurrencies.

When you join TradingLounge you have access to everything we offer, including trade tools, educational content and a social platform to chat with like-minded investors.

Read more

@Copyright 2024 by tradinglounge.com

Contact Us

Australian no: 02 4787 6020

International no: +61 (2) 47876020

Pay with:

Find us on