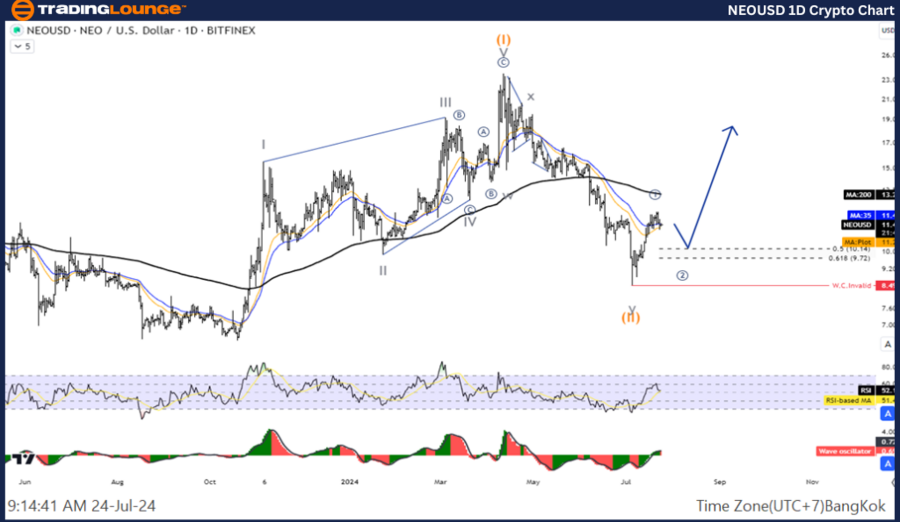
NEOUSD Elliott Wave Analysis - TradingLounge Daily Chart

NEO / U.S. Dollar (NEOUSD) Daily Chart Analysis

NEOUSD Elliott Wave Technical Analysis

Function: Counter Trend

Mode: Corrective

Structure: Double Corrective

Position: Wave Y

Direction Next Higher Degrees: Wave (II) of Impulse

Wave Cancel Invalid Level: 9.85

Details: The current analysis suggests that Wave (II) may have concluded, and the price is likely beginning an upward trend.

NEO / U.S. Dollar (NEOUSD) Trading Strategy:

Wave (II) in the NEOUSD pair is anticipated to finish around the 8.49 level, with the price expected to continue its upward movement. Traders should consider looking for entry points during short-term pullbacks to capitalize on this potential uptrend.

NEO / U.S. Dollar (NEOUSD) Technical Indicators: The price is currently below the 200-day moving average (MA200), indicating a general downtrend. However, the Wave Oscillator shows bullish momentum, suggesting potential upward movement.

NEOUSD-1D-Crypto-Cha...


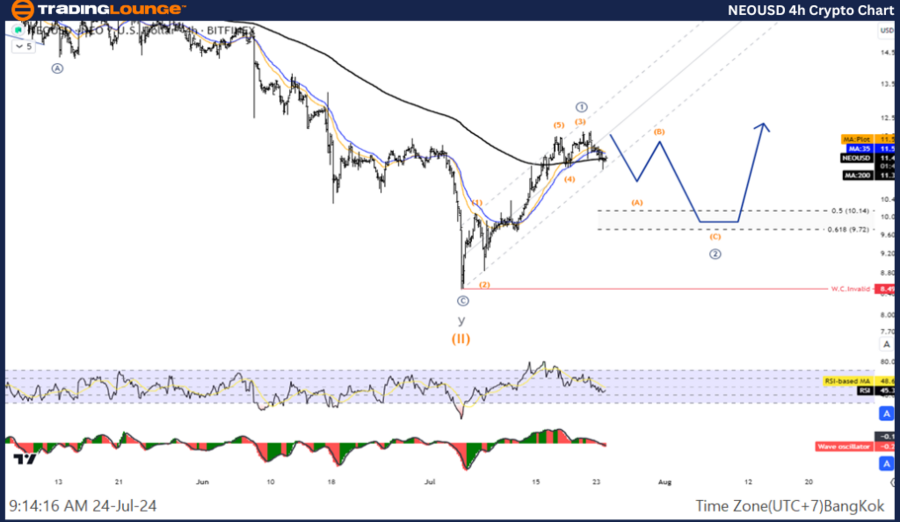
NEOUSD Elliott Wave Analysis - TradingLounge H4 Chart

NEO / U.S. Dollar (NEOUSD) 4-Hour Chart Analysis

NEOUSD Elliott Wave Technical Analysis

Function: Counter Trend

Mode: Corrective

Structure: Double Corrective

Position: Wave Y

Direction Next Higher Degrees: Wave (II) of Impulse

Wave Cancel Invalid Level: 9.85

Details: Similar to the daily chart analysis, Wave (II) appears to have reached its conclusion, indicating a possible resumption of the upward trend.

NEO / U.S. Dollar (NEOUSD) Trading Strategy:

The completion of Wave (II) around the 8.49 level signals potential for an uptrend. Investors and traders should seek opportunities to enter the market during minor corrections, aligning with the overall bullish outlook.

NEO / U.S. Dollar (NEOUSD) Technical Indicators: The price remains below the MA200, highlighting a longer-term downtrend. Nonetheless, the Wave Oscillator is exhibiting bullish signals, pointing towards a potential upward movement.

Technical Analyst:  Kittiampon Somboonsod

Source: visit Tradinglounge.com and learn From the Experts Join TradingLounge Here 

See Previous: Bitcoin / U.S. dollar (BTCUSD) Elliott Wave Technical Analysis

Special Trial Offer - 0.76 Cents a Day for 3 Months! Click here

Access 7 Analysts Over 170 Markets Covered. Chat Room With Support

NEOUSD-4hr-Crypto-Ch...

Related

The Coca-Cola Company (KO) - Stocks Analysis, Elliott Wave Technical Forecast & Price Prediction

The Coca-Cola Company (KO) - Stocks Analysis, Elliott Wave Technical Forecast & Price Prediction

Dive into the dynamic world of Coca-Cola's (KO) stock with our expert analysis guided by Elliott...

Read More >
U.S. Dollar / Japanese Yen (USDJPY) Forex Elliott Wave Technical Analysis: Insight to Forecast Potential Market Moves

U.S. Dollar / Japanese Yen (USDJPY) Forex Elliott Wave Technical Analysis: Insight to Forecast Potential Market Moves

This article provides a comprehensive Elliott Wave analysis for USDJPY, covering both the daily and ...

Read More >
Valuable insights: British Pound/ Australian Dollar (GBPAUD) Elliott Wave Technical Analysis

Valuable insights: British Pound/ Australian Dollar (GBPAUD) Elliott Wave Technical Analysis

The GBPAUD Elliott Wave Analysis for both the daily and 4-hour charts, underscores a counter-trend c...

Read More >
Potential Future of WTI and Oil Price Trends Based on Elliott Wave Analysis: Crude Oil Commodity Market Outlook

Potential Future of WTI and Oil Price Trends Based on Elliott Wave Analysis: Crude Oil Commodity Market Outlook

This article provides an in-depth Elliott wave analysis of WTI crude oil, highlighting key price mov...

Read More >
Decline in wheat prices: understand the current market trends with Wheat Commodity Elliott Wave Technical Analysis

Decline in wheat prices: understand the current market trends with Wheat Commodity Elliott Wave Technical Analysis

Explore our comprehensive Wheat Elliott Wave Analysis to understand the current price forecast and m...

Read More >
USDCHF Elliott Wave Technical Analysis: U.S. Dollar / Swiss Franc Forex Pair Analysis Indicates a Bullish Trend

USDCHF Elliott Wave Technical Analysis: U.S. Dollar / Swiss Franc Forex Pair Analysis Indicates a Bullish Trend

The USDCHF Elliott Wave analysis indicates a bullish trend, with active wave structures suggesting u...

Read More >

Buy 1 Month

Get 3 Months!

Special Offer:

Trade Recommendations

Unleash the power of deversified trading with our comprehensive portfolio, covering:

  • Stock Trades
  • Crypto Trades
  • Forex Trades
  • Commodity Trades
Elliott Wave Analysis

Gain a competive edge with expert insights in to:

  • Global Indices
  • US Stocks & ASX Stocks
  • Forex & Crypto
  • Commodities
Top-Notch Trading Tools

Equip yourself with the tools of success:

  • Social Chat
  • Elliott Wave Algorithm
  • Screener
  • TradingLevels
  • Trading Game
7 Elliott Wave Analysts

Stay ahead of the market with daily charts and insightful videos
-Your secret to strategic trading!

JOIN HERE


Welcome to TradingLounge (ASIC A.R.No. 321187), specialists in trades, trading education and technical analysis, covering stocks, indices, commodities, forex and cryptocurrencies.

When you join TradingLounge you have access to everything we offer, including trade tools, educational content and a social platform to chat with like-minded investors.

Read more

@Copyright 2024 by tradinglounge.com

Contact Us

Australian no: 02 4787 6020

International no: +61 (2) 47876020

Pay with:

Find us on