TradingLounge Commodity: Cocoa Elliott Wave Analysis

Cocoa Elliott Wave Technical Analysis

Cocoa prices have been consolidating within a range since mid-May 2024, fluctuating between $10,000 and $6,770. Despite minor rebounds, the likelihood of cocoa breaking the $6,770 support level remains high. The commodity touched this low on August 7, followed by a small bounce. However, the broader correction that began in April 2024, when cocoa peaked at an all-time high of $11,722, is expected to continue, potentially driving prices down to $6,000 or even below $5,000 in the coming weeks.

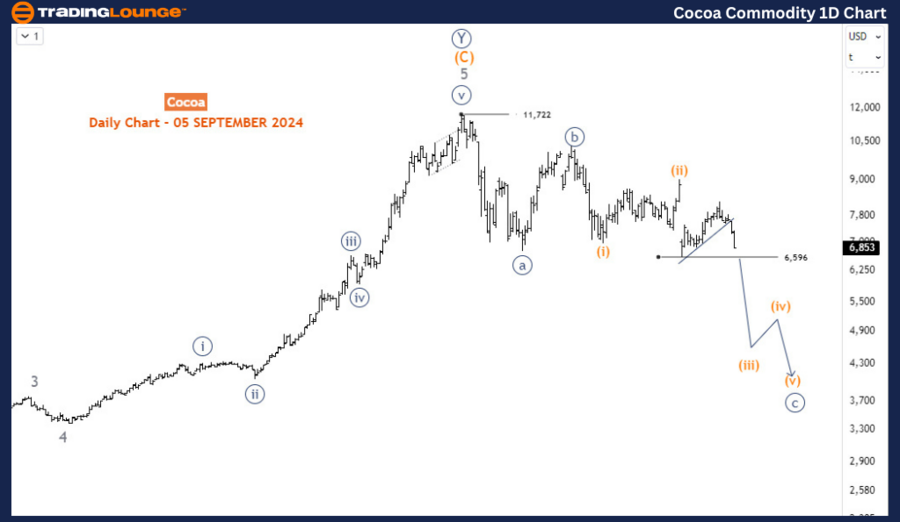
Cocoa Daily Chart Analysis

From a long-term perspective, cocoa completed a significant bullish impulse wave cycle that began in September 2022 when prices were around $2,000. This powerful impulse wave, consistent with Elliott Wave theory, propelled prices upward by over 430%, reaching a peak of $11,722 in April 2024. According to Elliott Wave principles, after such a substantial impulsive move, markets typically enter a three-wave corrective phase. Currently, cocoa is in this corrective phase, forming an a-b-c wave pattern.

In this structure, waves a and b (circled) have already completed. Wave a marked the initial decline from the all-time high, and wave b represented a brief rebound. The market is now in wave c, the final and most aggressive leg of this corrective phase. Wave c is expected to extend lower, potentially reaching $5,000 or below before the correction concludes. This decline is a natural progression following the massive bullish impulse, and upon completion, cocoa may either resume its upward trend or experience a corrective bounce.

Cocoa-Commodity-1D-C...


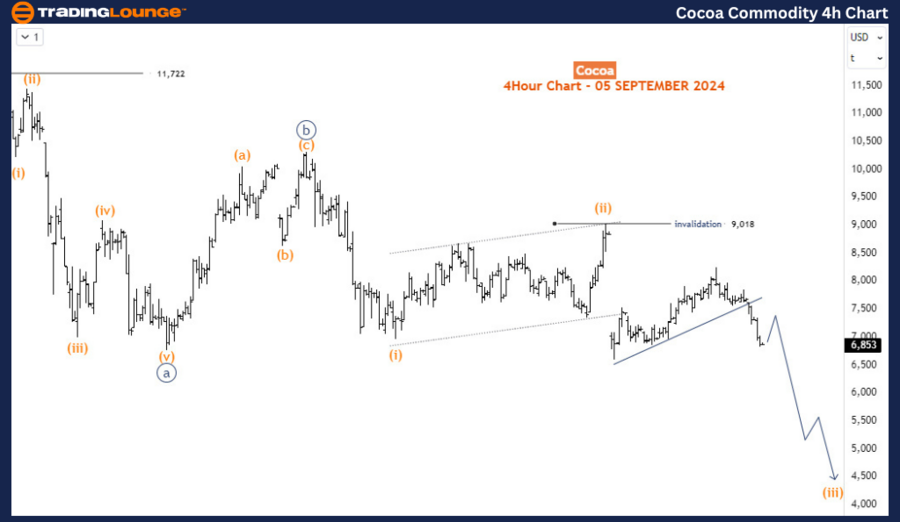
Cocoa H4 Chart Analysis

On the H4 chart, the ongoing corrective decline is unfolding in a 5-3-5 corrective pattern, typical of wave c movements. Wave c is currently in the third sub-wave, labeled wave (iii), which is typically the strongest part of the decline. Given the current momentum, it is likely that the $6,596 support level will be breached, extending the selloff that started at the $11,722 peak. The overall target for this wave is near $5,000, where support may emerge, leading to either a continuation of the long-term bullish trend or another corrective bounce.

This analysis underscores the ongoing bearish momentum in cocoa prices, with key levels indicating further downside before any significant recovery.

Technical Analyst: Sanmi Adeagbo

Source: visit Tradinglounge.com and learn From the Experts Join TradingLounge Here 

See Previous: Cron Elliott Wave Technical Analysis

Special Trial Offer - 0.76 Cents a Day for 3 Months! Click here

Access 7 Analysts Over 200 Markets Covered. Chat Room With Support

Cocoa-Commodity-4H-C...


Related

Our Expert U.S. Dollar/Canadian Dollar Technical Analysis and Forecasts with USDCAD Forex Elliott Wave Technical Analysis

Our Expert U.S. Dollar/Canadian Dollar Technical Analysis and Forecasts with USDCAD Forex Elliott Wave Technical Analysis

Our detailed USDCAD Elliott Wave analysis provides insights into the current market trends, focusing...

Read More >
Elliott Wave Analysis & Trading Strategies: NASDAQ, SP500, Top Tech Stocks

Elliott Wave Analysis & Trading Strategies: NASDAQ, SP500, Top Tech Stocks

This content provides Elliott Wave analysis and trading strategies focused on the NASDAQ 100, SP500,...

Read More >
Shanghai Composite Index Elliott Wave Technical Analysis - SSE Investment Insights and Shanghai Composite trading

Shanghai Composite Index Elliott Wave Technical Analysis - SSE Investment Insights and Shanghai Composite trading

Gain a deep understanding of Shanghai Composite trading with expert Elliott Wave analysis and action...

Read More >
ASX Computershare Limited CPU Stock Trends, Price Forecasts, and Elliott Wave Strategies to Capitalize on the Market

ASX Computershare Limited CPU Stock Trends, Price Forecasts, and Elliott Wave Strategies to Capitalize on the Market

Our detailed Elliott Wave analysis of Computershare Limited (CPU.ASX) highlights potential price mov...

Read More >
Understand the key Signals and Patterns in Gold's Market Movement: Gold (XAUUSD) Commodity Elliott Wave Analysis

Understand the key Signals and Patterns in Gold's Market Movement: Gold (XAUUSD) Commodity Elliott Wave Analysis

This article provides a comprehensive Gold Elliott Wave analysis, covering gold price predictions, m...

Read More >
Capitalize on the Ongoing Trends in the NZDUSD Currency Pair: New Zealand Dollar/ U.S. Dollar Elliott Wave Technical Analysis

Capitalize on the Ongoing Trends in the NZDUSD Currency Pair: New Zealand Dollar/ U.S. Dollar Elliott Wave Technical Analysis

Delve into our comprehensive NZDUSD Elliott Wave analysis, focusing on both daily and 4-hour charts....

Read More >

Buy 1 Month

Get 3 Months!

Special Offer:

Trade Recommendations

Unleash the power of deversified trading with our comprehensive portfolio, covering:

  • Stock Trades
  • Crypto Trades
  • Forex Trades
  • Commodity Trades
Elliott Wave Analysis

Gain a competive edge with expert insights in to:

  • Global Indices
  • US Stocks & ASX Stocks
  • Forex & Crypto
  • Commodities
Top-Notch Trading Tools

Equip yourself with the tools of success:

  • Social Chat
  • Elliott Wave Algorithm
  • Screener
  • TradingLevels
  • Trading Game
7 Elliott Wave Analysts

Stay ahead of the market with daily charts and insightful videos
-Your secret to strategic trading!

JOIN HERE


Welcome to TradingLounge (ASIC A.R.No. 321187), specialists in trades, trading education and technical analysis, covering stocks, indices, commodities, forex and cryptocurrencies.

When you join TradingLounge you have access to everything we offer, including trade tools, educational content and a social platform to chat with like-minded investors.

Read more

@Copyright 2024 by tradinglounge.com

Contact Us

Australian no: 02 4787 6020

International no: +61 (2) 47876020

Pay with:

Find us on